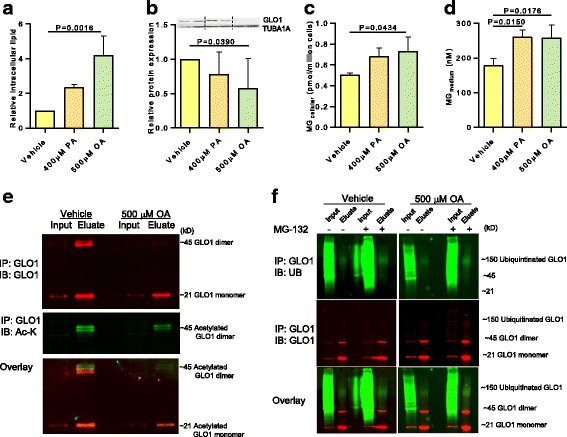
Fig. 4.

Dysregulation of GLO1 in response to lipid loading. HepG2 cells were treated with vehicle, palmitic acid (PA) or oleic acid (OA) for 24 h. a Intracellular lipid accumulation measured by Nile Red assay, b Immunoblotting and quantification of GLO1 expression relative to TUBA1A, c Cellular methylglyoxal (MG) levels, and d Medium MG levels from vehicle or fatty acid treated HepG2 cells. Data are mean ± SD, n = 3–4 independent experiments. e Acetylation of endogenous GLO1 immunoprecipitated (IP) from extracts of vehicle or OA treated HepG2 cells with a rabbit anti-GLO1 antibody and immunoblotted (IB) with rat anti-GLO1 and mouse anti-acetylated lysine. Top panel in red is GLO1 monomer (~21kD) and dimer (~ 45) detected in immunoprecitates of GLO1; less GLO1 dimer is immunoprecipitated from OA treated cells. Middle panel in green is detection of the GLO1 dimer with an anti-acetyl-lysine antibody, with less observed in the GLO1 immunoprecipitates of OA treated cells. Bottom panel is overlay. f Ubiquitination of endogenous GLO1. Top panel shows ubiquitin detection between 100-150kD in green, in immunoprecipitates of endogenous GLO1; addition of the proteasome inhibitor MG-132 increases GLO1 detection, particularly in OA treated cells. Middle panel shows GLO1 detection in red; very faint banding in the 150 K range only detectable in the eluates from OA and MG-132 co-treated cells. Bottom panel is overlay
