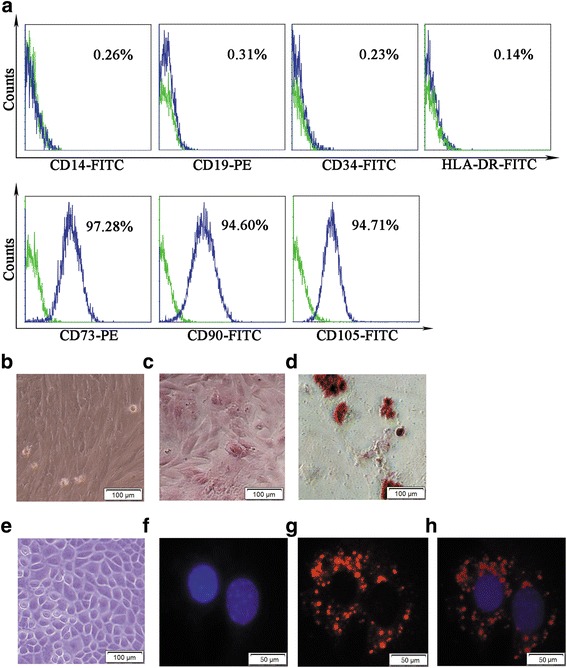
Fig. 1.

Cell surface markers, morphology and pluripotency of hPMSCs and GCs. Green histograms represent isotype control staining; blue histograms represent expression of indicated cell surface marker (a). hPMSCs cultured under conditions for differentiation into osteoblasts or adipogenesis (b–d). Cultured hPMSCs shows fibroblast-like morphology (b, ×200). Osteoblasts are displayed by Alizarin Red staining; darker red staining indicates calcium deposition (c, ×200). Adipogenesis displayed by accumulation of neutral lipid vacuoles stained with Oil Red O (d, ×200). Morphology and phenotypes of GCs (e–h). GCs shown as spindle-shaped morphology (e, ×200). DAPI staining (blue fluorescence) indicates the GC nucleus (f, ×400). FSHR-positive expression identified under Dylight 549 (red fluorescence) (g, ×400). Double-labeled staining (blue and red fluorescence) cells defined as FSHR-positive expression in GCs (h, ×400). FITC Annexin-V-fluorescein isothiocyanate, PE phycoerythrin
