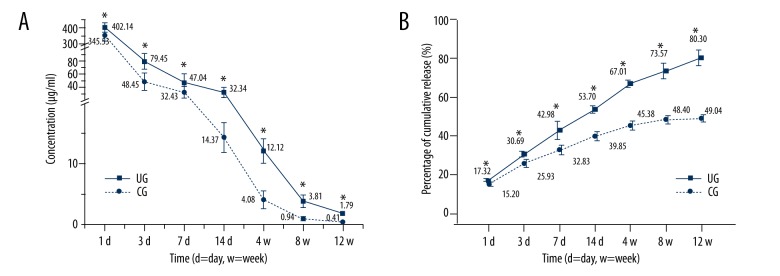
Figure 2.
LFPUS enhanced vancomycin release. (A) The vancomycin concentration in the eluted samples after LFPUS treatment were higher than that of the control group (p<0.05 in each time point). (B) The percentage of cumulative released vancomycin for the 2 groups and the cumulation in UG was significantly more than that in the CG (p<0.05 in each time point) (* P<0.05).

