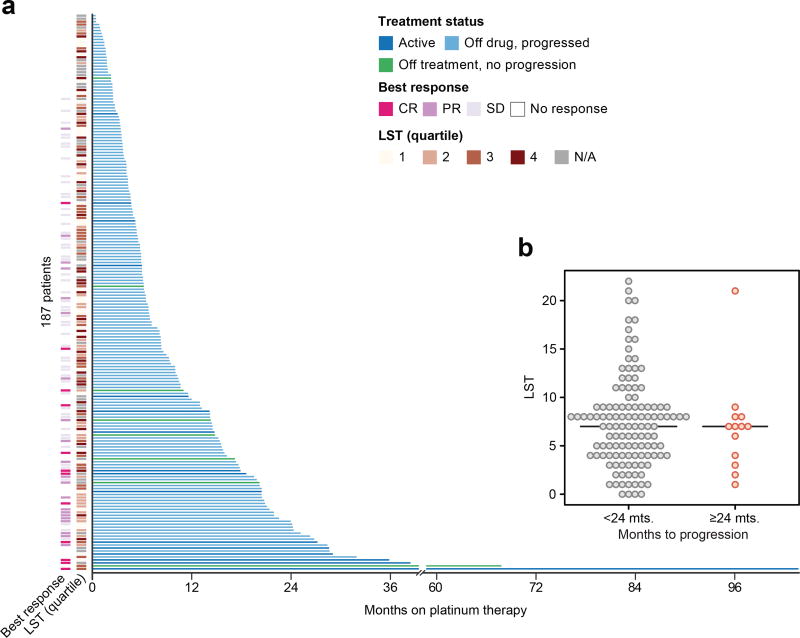
Figure 2. Genomic determinants of response to cytotoxic chemotherapy.
A, Swimmer’s plot showing months on first-line platinum-based therapy for 185 patients with metastatic, HER2-negative esophageal cancer. The annotation tracks on the left of the y-axis indicate the patient's best response to platinum and the estimated LST score. The color of individual bars indicate the current status of the patient on this line of treatment. B, Distribution of LST scores in patients that progressed on platinum treatment before 24 months compared to patients with prolonged response (>24 months). Horizontal bars represent the median by group.

