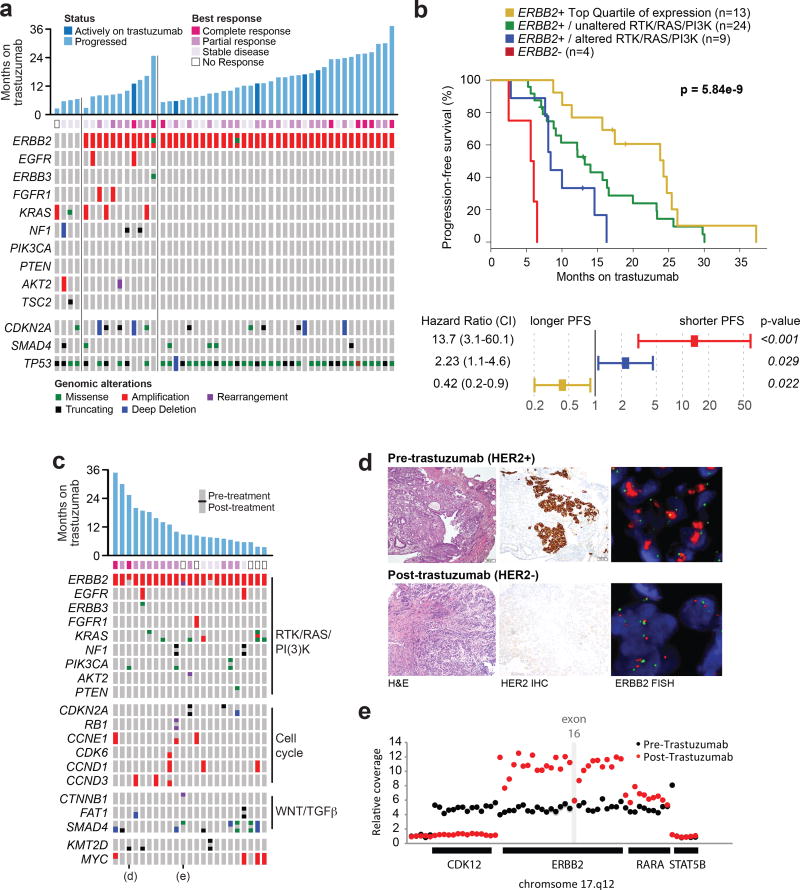
Figure 4. Intrinsic and acquired trastuzumab resistance.
A, Duration, best response, and pre-treatment genomic alterations for 50 patients with HER2+ metastatic esophagogastric cancer treated with first-line trastuzumab/chemotherapy. The first four tumors had no ERBB2 amplification detected by sequencing, the next set of samples had co-alterations in the RTK/RAS/PI3K pathways, and the third set had no co-occurring alterations in these pathways. B, Kaplan-Meier progression free survival curves (top panel) and multivariate analysis (bottom panel) showing favorable outcome in patients with ERBB2-amplified and RTK/RAS/PI3K-wildtype tumors. Patients with tumors that were ERBB2-negative or ERBB2-amplified and RTK/RAS/PI3K pathway-activated had significantly shorter time to progression on first-line trastuzumab therapy, and patients in the highest quartile of ERBB2 levels as determined by sequencing had the best outcome. C, Analysis of somatic alterations in 23 pairs of matched pre- and post-trastuzumab samples. The oncoprint illustrates several oncogenic alterations, grouped by pathway, that are shared between or private to the paired pre- or post-treatment samples. The cells of the oncoprint are split, with the alteration status in the pre- and post-treatment samples shown in the top and bottom, respectively. D, A representative case illustrating loss of ERBB2 amplification and HER2 protein expression in the post-treatment sample, confirmed by FISH and IHC, respectively. E, The structure of the acquired ERBB2 exon 16 deletion in a post-trastuzumab specimen. The relative DNA-sequencing coverage is shown for each exon of ERBB2 and the adjoining genes on chromosome 17, as well as select intragenic regions. The post-trastuzumab sample had a distinct, more focal, amplification that did not include exon 16 of ERBB2.

