
Figure 2.
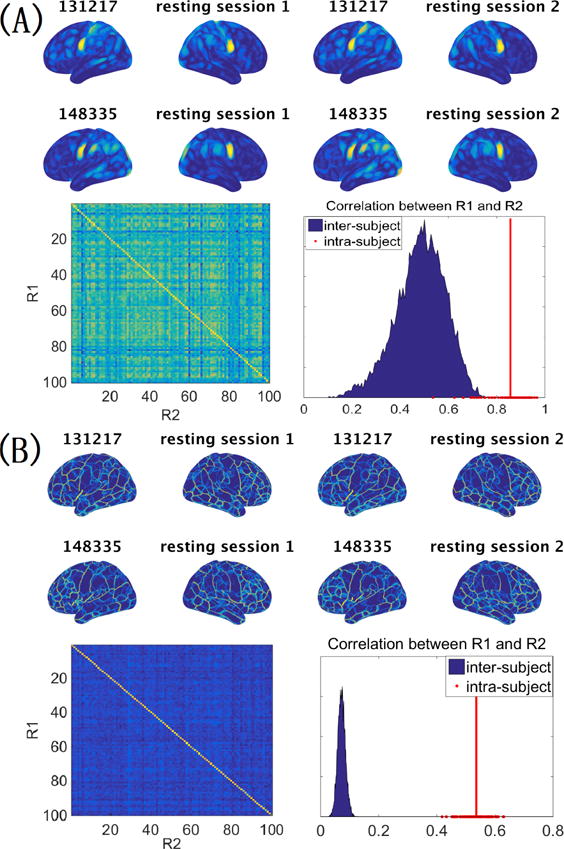
The functional density and edge maps derived from resting-state fMRI are unique at the individual level. (A) Functional density maps computed from the two resting-state fMRI sessions of two randomly selected subjects (upper panel). When correlating the functional density maps of two resting-state sessions for each pair of subjects, intra-subject correlations are much higher than inter-subject correlations (lower panel). (B) Comparison of the functional edge maps computed from different subjects (upper panel), and the comparison of intra-subject inter-session variation and inter-subject variation of the functional edge map (lower panel). In both (A) and (B), the red line corresponds to the average of the intra-subject correlations.