
Figure 3.
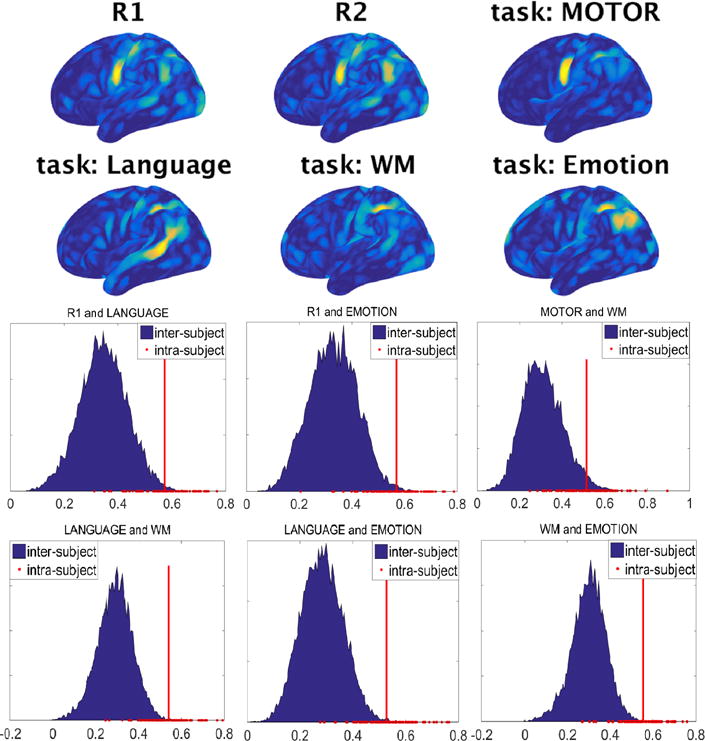
The functional density maps capture intrinsic properties of the functional organization across resting and task conditions. Intra-subject correlations of the functional density maps between different rest-task and task-task pairs are significantly higher than inter-subject correlations. In all panels, the red line corresponds to the average of the intra-subject correlations.