
Figure 6.
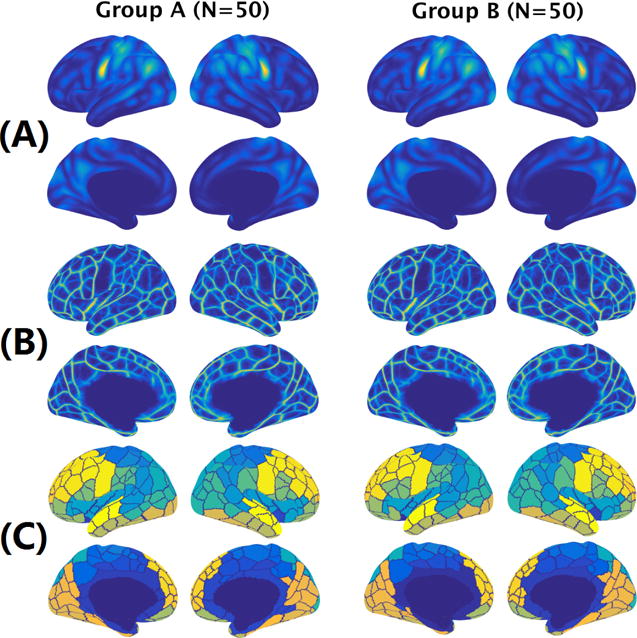
Group-average functional density and edge maps are highly reproducible. (A) The average functional density maps computed from two independent groups. The correlation between the two density maps was 0.997. (B) The average functional edge maps computed from two independent groups. The correlation between the two density maps was 0.987. (C) Cortical parcellations derived from the average functional edge maps with the number of parcels set to 150. A Dice coefficient of 0.916 was achieved between the parcellations derived from the two independent groups.