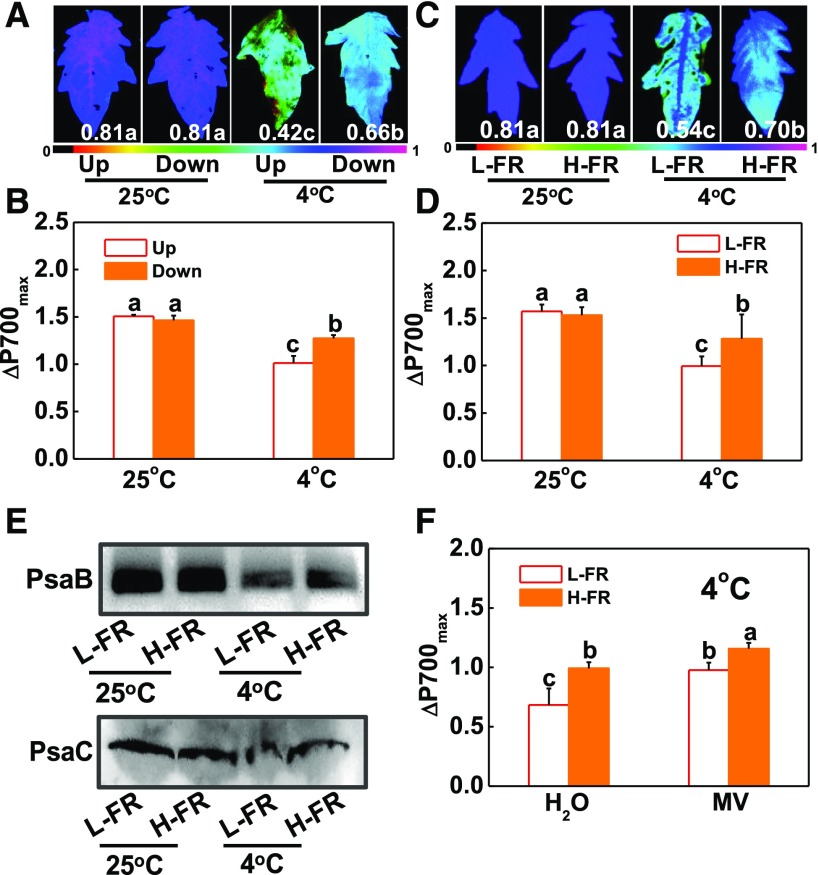
Figure 1.
Spatial variation in photoinhibition is partially attributable to the changes in light quality conditions. A and B, Maximum photochemical efficiency of PSII (Fv/Fm, A), maximum P700 photooxidation level (ΔP700max, B) in leaves at the 9th (Up) and 5th (Down) ranks from the base in plants at 11-leaf stage under white light conditions after exposure to 4°C for 7 d. C and D, Fv/Fm (C) and ΔP700max (D) at 4th leaves of the tomato plants at 6-leaf stage grown in temperature-controlled chambers at 25°C or 4°C under l-FR or H-FR light conditions for 7 d. The false color code depicted at the bottom of the image ranges from 0 (black) to 1.0 (purple) represents the level of damage in leaves. E, Immunoblot detection of thylakoid proteins (PsaB and PsaC) separated by SDS-PAGE. Detached leaves were exposed to 25°C or 4°C for 3 d under l-FR or H-FR. F, Effect of MV on the ΔP700max under cold stress in different light quality. After treated with 25 μM MV for 3 h in darkness at 25°C, leaves were transferred to 4°C for 6 h under different light quality conditions. For the l-FR and H-FR, R/FR values at 1.5 and 0.5, respectively, plants were kept at R conditions (200 μmol m−2 s−1) supplemented with different intensities of FR (133 and 400 μmol m−2 s−1). Data are the means (±sd) of four biological replicates except for Fv/Fm, which was the mean for 15 leaves from independent plants. Different letters indicate significant differences (P < 0.05) according to the Tukey’s test.

