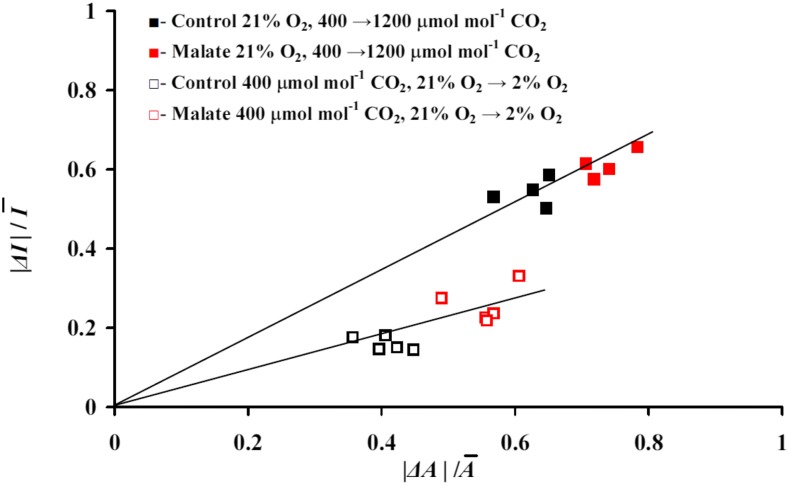
Figure 4.
Correlations among relative changes in net assimilation rate (Rc,A = ΔA/Ā) and isoprene emission (Rc,I = ΔI/Ī) due to changes in ambient CO2 concentration from 400 to 1,200 µmol mol−1 under 21% oxygen and due to changes in ambient oxygen concentration from 21% to 2% under 400 µmol mol−1 in control and malate-inhibited leaves across different experiments (for sample experiments, see Fig. 3). Here, ΔA and ΔI are differences in steady-state net assimilation and isoprene emission rates before and after the change in gas composition, and Ā and Ī are average values for these steady states (Rasulov et al., 2016). To show the data in the same scale, we used here the absolute differences |ΔA| and |ΔI| (for average nontransformed data, see Table III).

