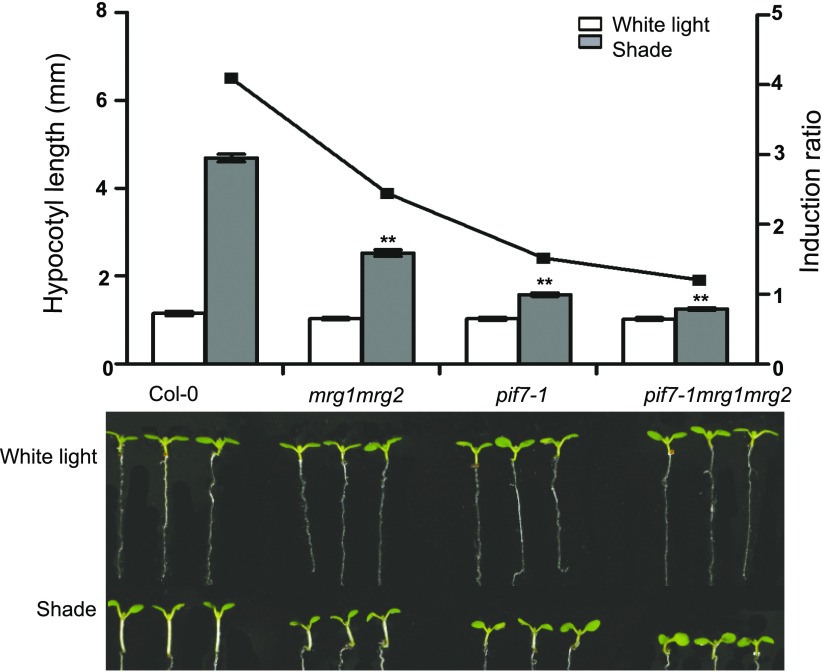
Figure 1.
Quantification of hypocotyl length and representative seedlings of Col-0, pif7-1, mrg1mrg2, and pif7-1mrg1mrg2. Seedlings were grown under white light for 4 d and maintained in white light or transferred to shade for next 3 d before the measurement of hypocotyl length. The left y axis is the mean of hypocotyl length from three biological replicate measurements presented in Supplemental Table S1, and the right y axis is the ratio of hypocotyl lengths in shade to that in white light. Error bars represent se. Asterisks indicate where the difference between Col-0 and mutant is statistically significant (**P < 0.01).

