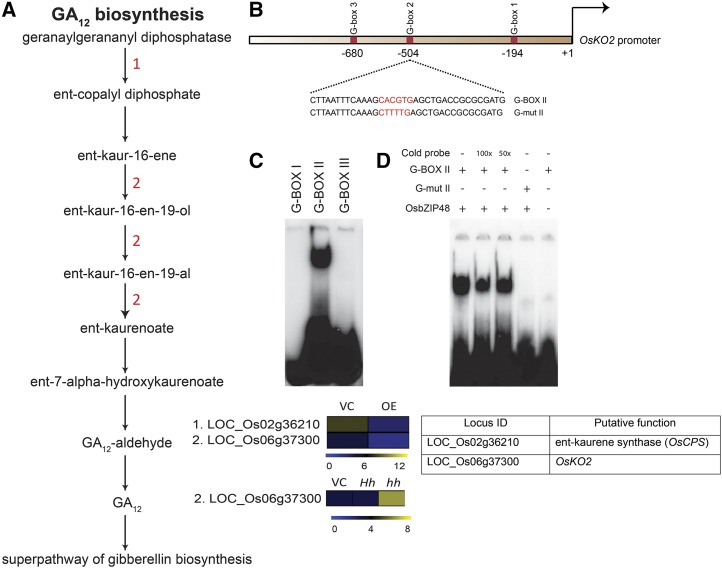
Figure 10.
A, Schematic representation of the GA biosynthesis pathway showing altered gene expression in OsbZIP48OE and OsbZIP48KD transgenics. The color bar at the base represents log2 expression values, with blue representing low-level expression, black representing medium-level expression, and yellow signifying high-level expression. The numbers in red in the pathway correspond to the serial number of the locus identifier in the heat map (i.e. the gene with the serial number performs in the step where it is mentioned in the pathway). VC, Vector control. B, Schematic representation of the OsKO2 1-kb promoter showing the location of three G-box motifs. In the diagram, the sequence of the probe is given with the G-box sequence (CACGTG) highlighted in red. The G-mut II probe sequence shows the mutated G-box sequence and is highlighted in red. These probes were labeled with 32P for electrophoretic mobility shift assay (EMSA). C, OsbZIP48 binds in vitro to G-box II in the OsKO2 promoter in EMSA. D, EMSA gel showing OsbZIP48 in vitro binding to G-box II in the OsKO2 promoter with proper controls. For the assay, the radiolabeled probes were incubated with OsbZIP48 protein. Cold (unlabeled) probe (100× or 50×), G-box II probe, and G-mut II probe were used as indicated.

