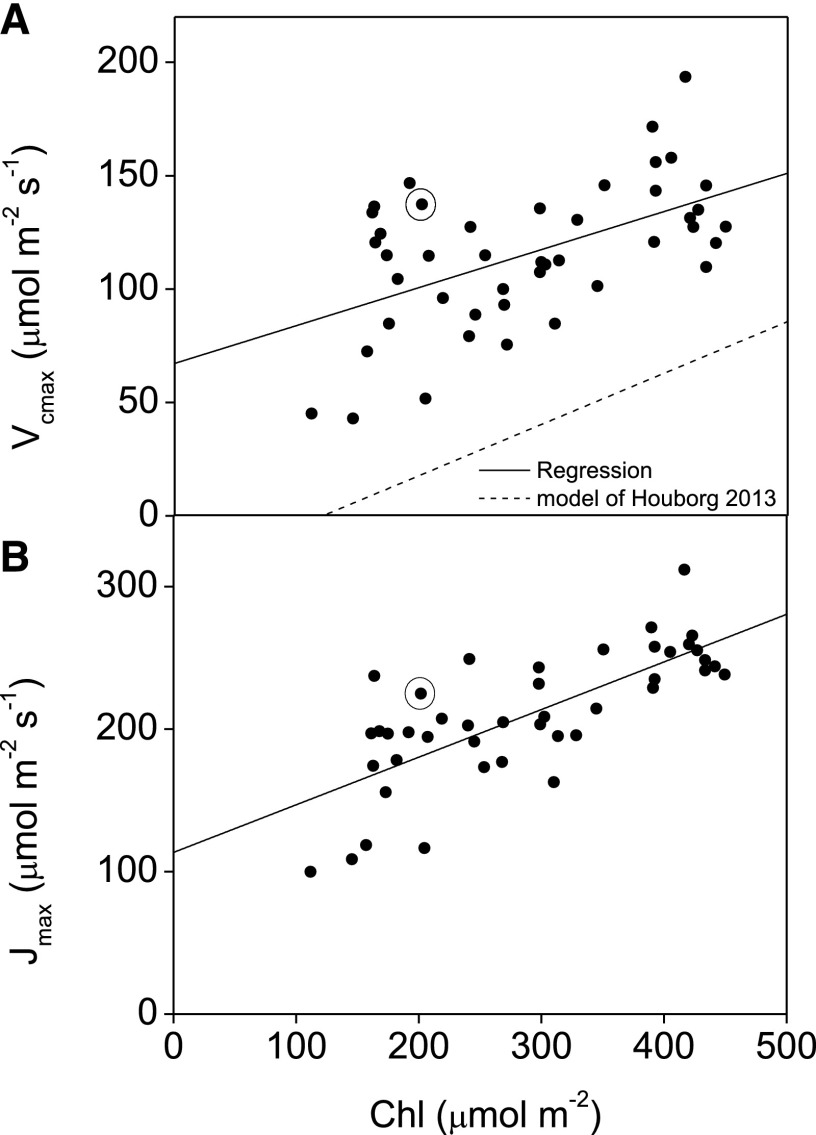
Figure 3.
a, b, Observed impact of the variation in Chl content on photosynthetic performance. Forty-five plants from various cultivars of soybean were measured using a 6400-XT gas exchange system (LI-COR) to derive maximum rate of carboxylation (Vcmax) and electron transport (Jmax) from photosynthetic carbon dioxide response curves. Chl was determined from SPAD (Soil Plant Analysis Development) measurements according to the relationship presented in Supplemental Fig. S12. Also shown is the modeled relationship of Chl to Vcmax of Houborg et al. (2013; dotted line). Circled data represents the values measured in the low chlorophyll mutant Y11y11.

