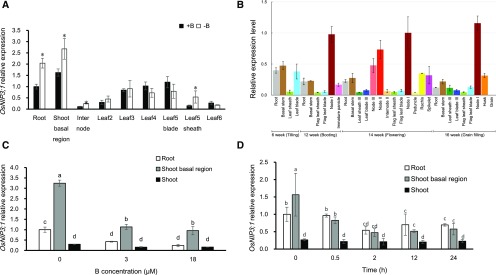
Figure 1.
Expression pattern of OsNIP3;1 in rice. A, Expression of OsNIP3;1 in different organs of plants with or without B at vegetative growth stage. Seedlings (22-d-old, cv Hwayoung) were cultured in a solution containing 0 μM (−B) or 3 μM B (+B) for 7 d. Different organs were sampled for expression analysis. B, Expression of OsNIP3;1 in different organs of rice grown in a field at different growth stage. Different organs of rice (cv Nipponbare) grown in a paddy field were sampled at different growth stage shown. C, Effect of different B concentration on OsNIP3;1 expression. Seedlings (32-d-old, cv Hwayoung) precultured in B-free solution for 3 d, were exposed to a solution containing 0 μM, 3 μM, or 18 μM of B for 24 h. Different organs including roots, shoot basal region, and shoots were sampled. D, Time-dependent expression of OsNIP3;1 in response to external B. Seedlings (16-d-old, cv Hwayoung) precultured in B-free solution for 7 d, were exposed to 3 μM B for different times indicated, and the roots, shoot basal region, and shoots were sampled. The expression level was determined by real time RT-PCR. HistoneH3 and Ubiquitin were used as internal standards. Expression relative to the roots is shown. Data are means ± sd (n = 3). Asterisk shows significant difference at P < 0.05 between +B and −B. Different small letter indicates significant difference at P < 0.05 by Duncan’s test.

