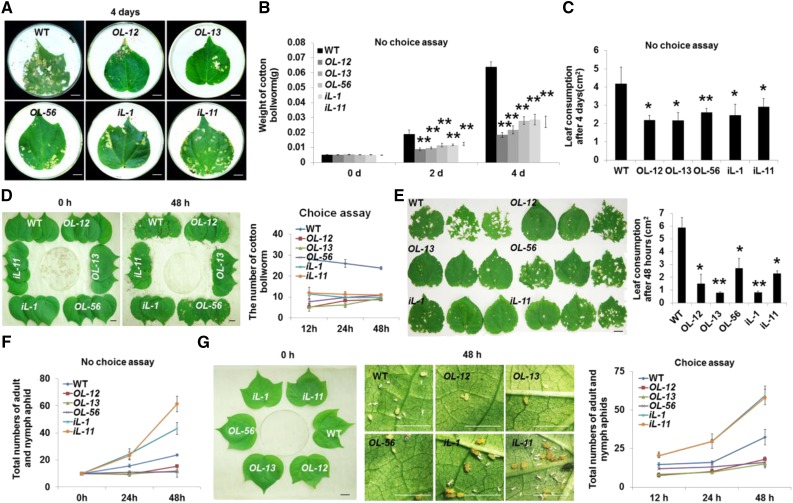
Figure 2.
GhLac1 effect on tolerance to insect pests. A, No-choice feeding assay for cotton bollworms. The second-instar cotton bollworms were prestarved for 6 h, and photographed at 4 d after cotton bollworm feeding on leaves from transgenic and wild-type plants. B, The weights of cotton bollworms fed with the leaves from each line. The values are the means ± sd; n = 10. C, Leaf consumption in the no-choice assay for cotton bollworms determined using the software ImageJ (National Institutes of Health). Values are means ± sd; n = 10. D, Choice feeding assay of cotton bollworms. The second-instar cotton bollworms were prestarved for 6 h, and photographed at 0 h and 48 h. The number of cotton bollworms on the leaves from each line was recorded at 12 h, 24 h, and 48 h. Values are the means ± sd; n = 4. E, Leaf consumption in the choice feeding assay for cotton bollworms using ImageJ. Values are the means ± sd; n = 10, and photographed 48 h after cotton bollworm treatment. F, No-choice feeding assay for cotton aphids. The number of adult and nymph aphids on the leaves from each line in the no-choice assay was recorded at 24 h and 48 h. G, Choice feeding assay for cotton aphids. Photos were taken at 48 h after introduction of aphids using a microscope (DM2500, Leica). The number of cotton aphids on the leaves from each plant line was recorded at 12 h, 24 h, and 48 h. Values are the means ± sd; n = 4. Statistical analyses were performed using Student’s t test. *, P < 0.05; **, P < 0.01. All of the experiments were repeated at least three times with similar results. Bars = 1 cm.

