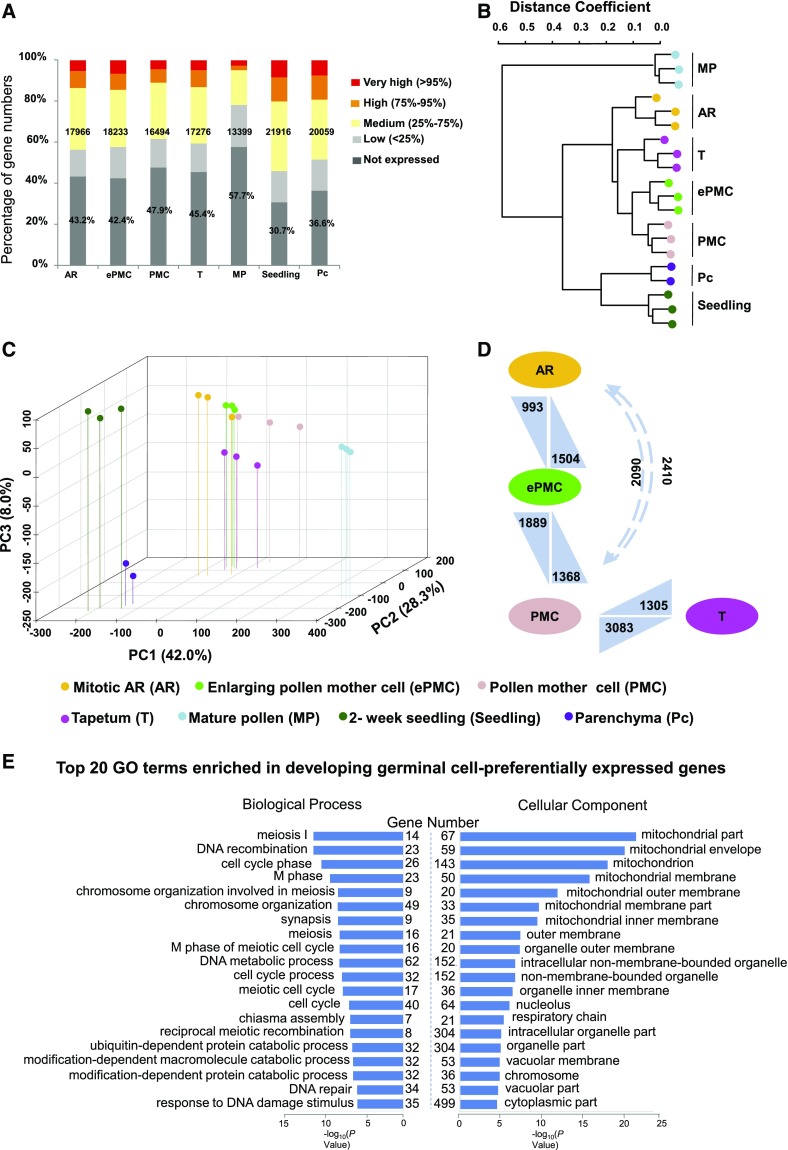
Figure 2.
Global expression levels, principal component analysis, and hierarchical clustering for gene expression data of seven samples. A, Percentages of genes in different categories according to their expression levels. Numbers indicate expressed genes in each sample. Percentages refer to genes that are not expressed. B, Hierarchical clustering dendrogram using Pearson correlation coefficients. C, Principle component analysis for gene expression data of the seven samples. Spatial distribution of the first three principle components is shown. D, Numbers of differentially expression genes. Arrows point to the sample with up-regulated genes. E, GO enrichment analysis. The x axis indicates the significance level (scored as –log(P value)) from Fisher’s exact test and y axis represents Numbers of genes preferentially expressed in developing germinal cells fall in the indicated GO terms are listed.

