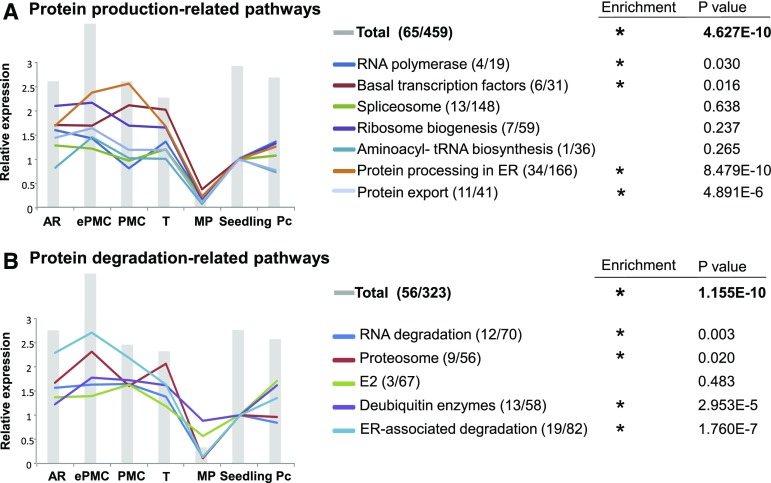
Figure 4.
Protein turnover (both production and degradation) are maintained at high levels in premeiotic germinal cells. Relative total intensities of genes in each KEGG pathway leading to protein production (A) or degradation (B). Gray bars represent total intensities of all the genes included in protein production (A) or protein degradation (B). The relative total expression of genes in each subcategory in different sample compared to that of seedling are shown in lines. The first and second numbers after each pathway indicated the number of genes present on developing germinal cell-preferential and genes present on microarray, respectively. For details, see Supplemental Dataset 4.

