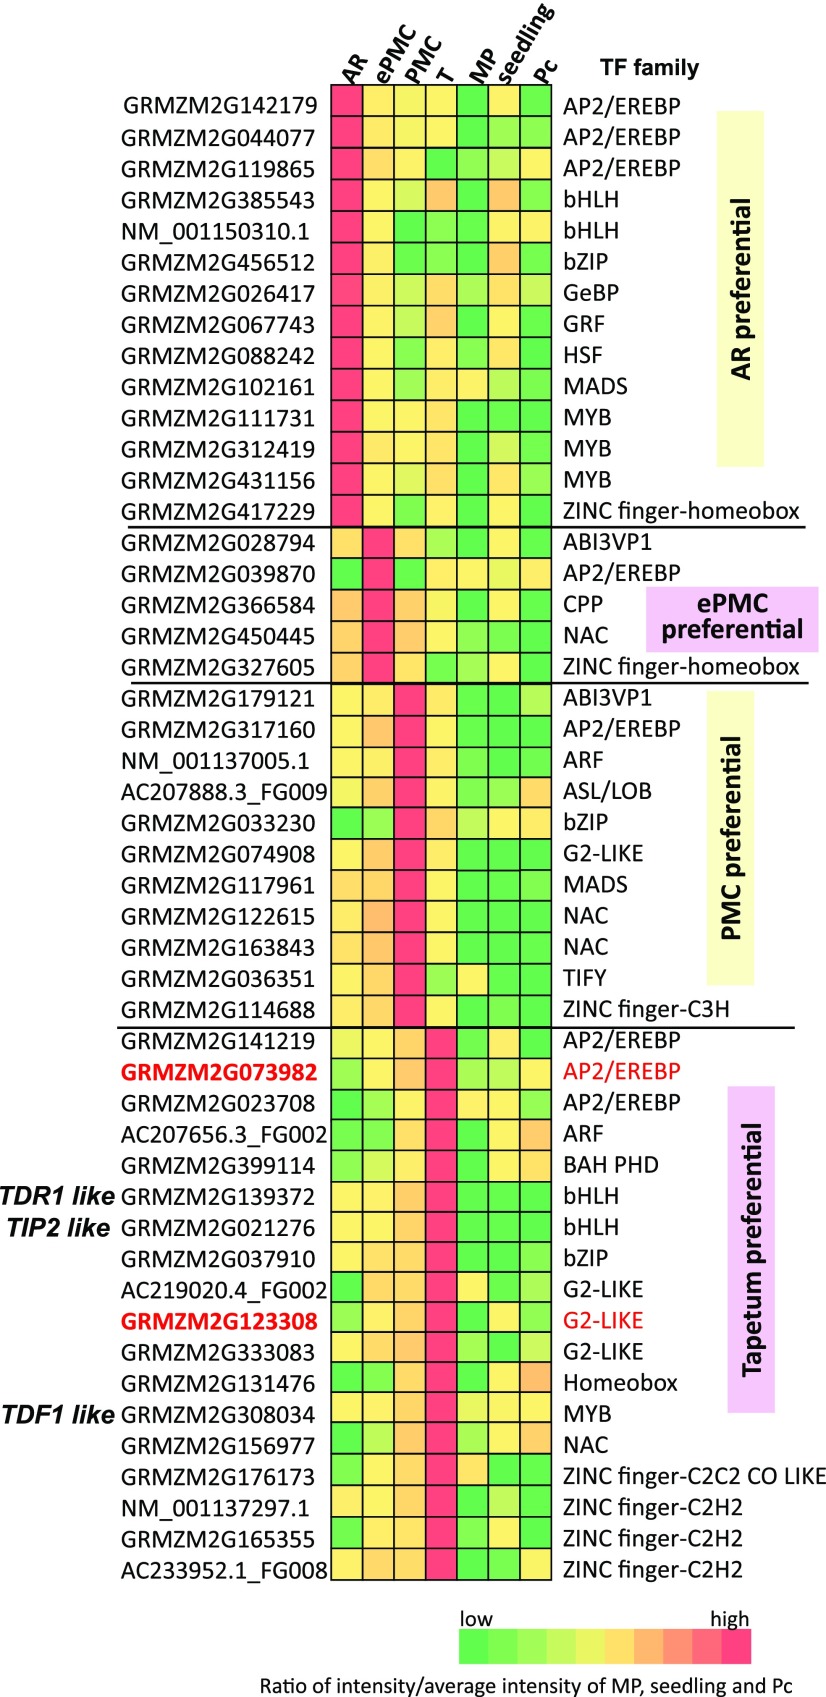
Figure 6.
A heatmap presentation of relative expression levels of transcription factors from various families that are preferentially expressed in developing germinal or tapetal cells. See also Supplemental Table S6 for detailed information. The two genes analyzed in in situ hybridization are in red.

