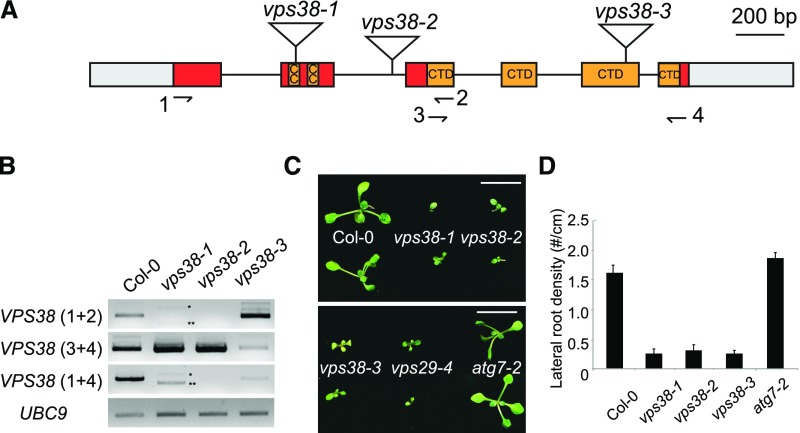
Figure 2.
Arabidopsis vps38 mutants show phenotypic similarity to retromer mutants but not to autophagy mutants. A, Diagram of the VPS38 gene. Exons (boxes) and introns (connecting lines) are shown with T-DNA insertion sites (triangles). Gray boxes illustrate untranslated regions, whereas colored boxes represent coding regions. Coding sequences for coiled coil regions and a conserved C-terminal BARA2 domain (see Supplemental Fig. S1) are indicated. B, Transcript analysis of vps38 mutants. RT-PCR was performed to determine VPS38 transcript levels using three pairs of primers (see arrows in the gene diagram for primer positions) and UBC9 transcript level (internal control). Asterisks indicate vps38-1-specific RT-PCR products representing two aberrant splice variants that either skip exon 2 (**) or contain additional nucleotides derived from T-DNA vector sequence (*). C, Picture of 10-d-old seedlings with indicated genotypes. Bars = 10 mm. D, Lateral root density of seedlings with indicated genotypes. Seedlings were vertically grown for 9 d. Each bar represents the mean value ± se from more than 16 seedlings. CC, coiled coil; CTD, conserved C-terminal domain.

