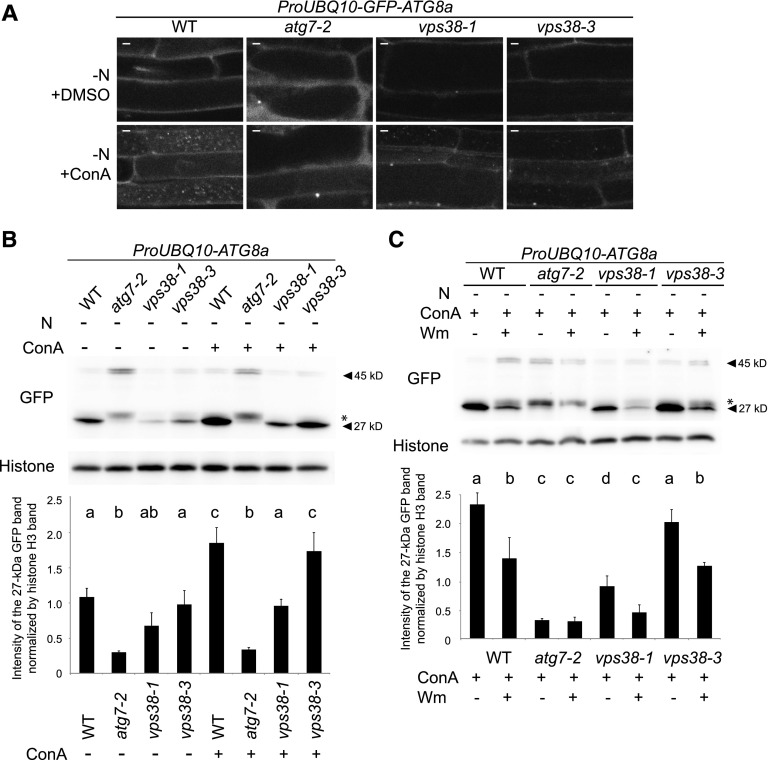
Figure 4.
Autophagy flux under N starvation is reduced but not fully inhibited in vps38-1. A, Images of the autophagy marker line GFP-ATG8a in the genetic backgrounds of wild type, atg7-2, vps38-1, and vps38-3. Seven-d-old seedlings were starved for nitrogen for 32 h, and subsequently treated with DMSO or 1 μm ConA for 16 h. Bar = 5 μm. B and C, GFP-ATG8a processing assay of wild type, atg7, vps38-1, and vps38-3. Where applicable, seedlings were treated with N starvation for 2 d, 30 μm Wm for 16 h, or 1 μm ConA for 16 h before protein extraction. A protein band indicated by an asterisk is an autophagy-independent cleavage product of GFP-ATG8a (Shin et al., 2014). Graphs below illustrate the quantification of 27-kD GFP band intensities normalized by those of histone H3. Mean ± se. n = 6 (B) and 5 (C). Columns marked with different letters represent significantly different means according to two-way ANOVA followed by Tukey’s test (P < 0.01). WT, wild type. −N, nitrogen starvation.

