Figure 1.
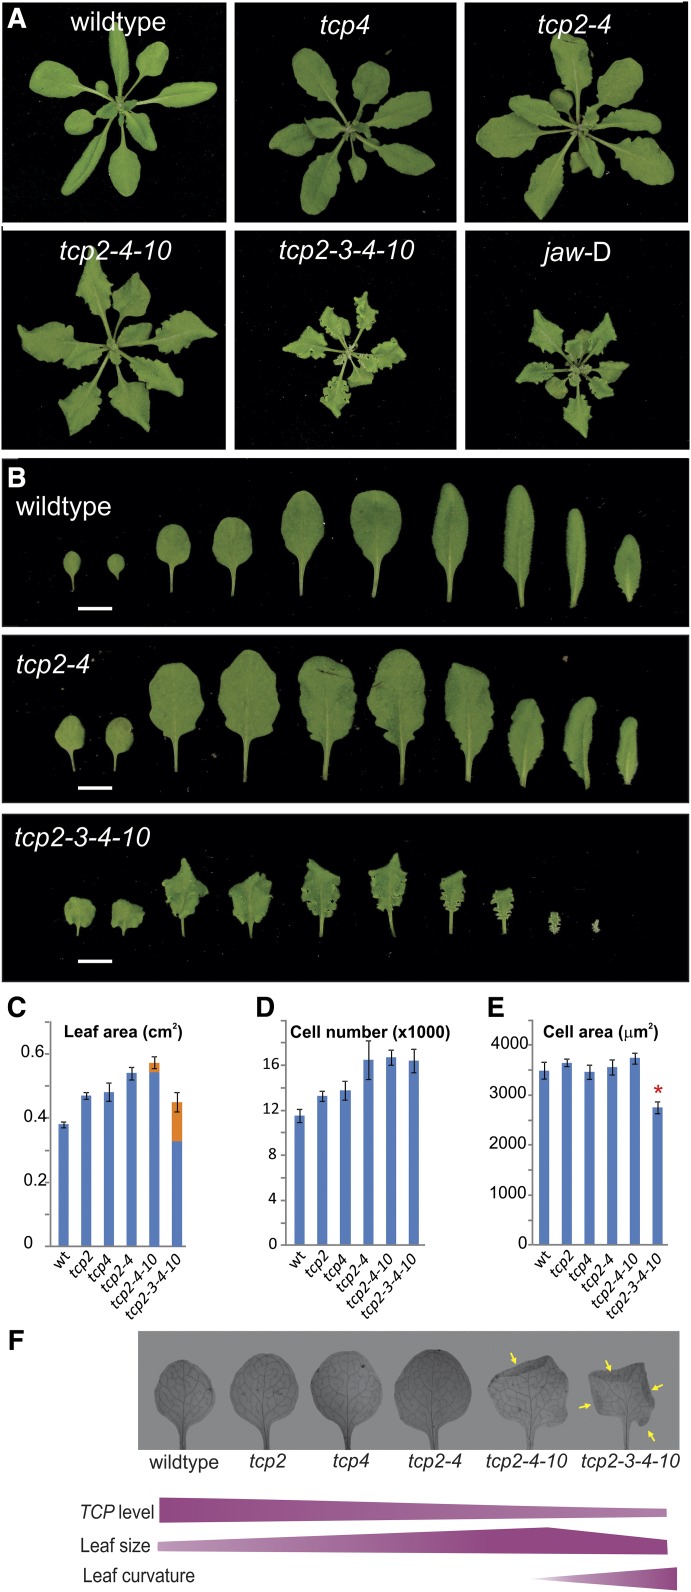
Effects of decreasing TCP levels on leaf size and shape. A, Four-week-old rosettes of Arabidopsis plants with decreased levels of TCP activity. B, Disassembled rosettes of the indicated genotypes. C, Leaf area of and two of the indicated genotypes. Marked in orange are the contributions of folded regions to the total leaf area (see “Materials and Methods”). D, Number of cells in the same leaves as in C. E, Cell area of the same leaves as in C. The asterisk indicates statistical significance of the difference according to P < 0.01 by Student’s t test. wt, Wild type. F, Cleared and flattened leaves of the different genotypes that have reduced TCP activity. Yellow arrows indicate folded regions. Violet bars illustrate how leaf size and curvature develop with respect to the gradual reduction of TCP activity. The mutants tcp2 tcp4, tcp2 tcp4 tcp10, and tcp2 tcp3 tcp4 tcp10 are labeled tcp2-4, tcp2-4-10, and tcp2-3-4-10, respectively.

