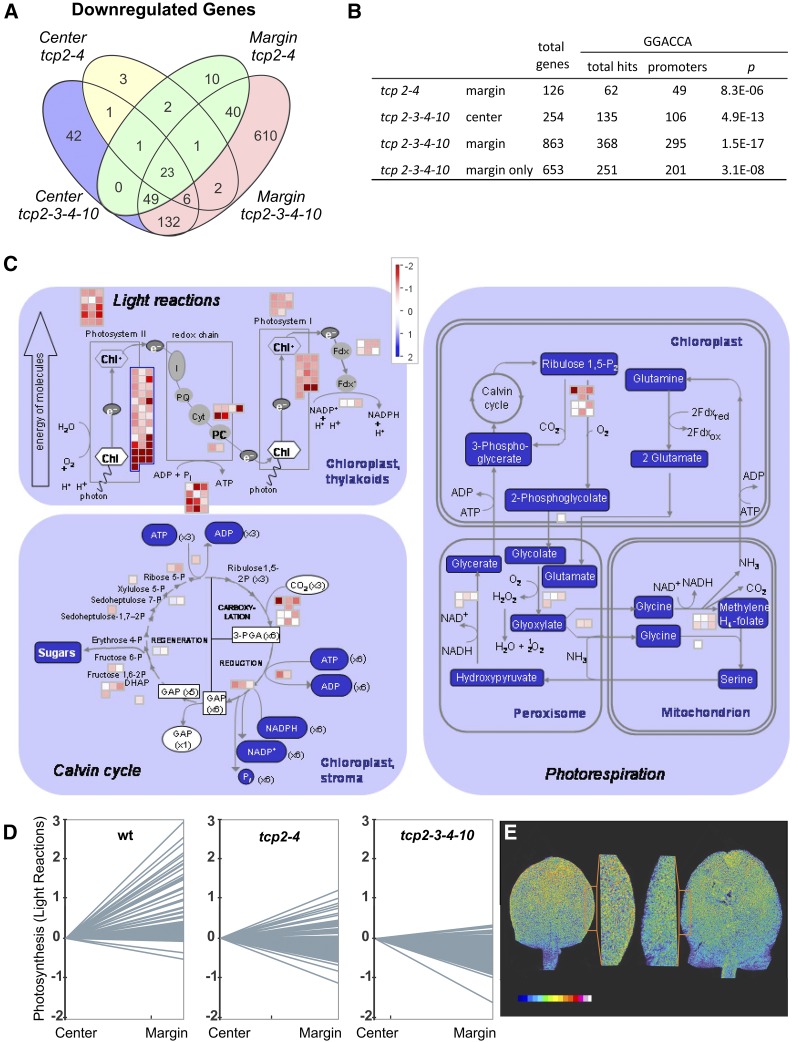
Figure 3.
Coordination of gene expression related to photosynthesis by miR319-regulated TCPs. A, Venn diagram showing the intersections of down-regulated genes in margins and centers of tcp2 tcp4 and tcp2 tcp3 tcp4 tcp10 compared with the wild type. B, Promoter analysis of down-regulated genes in tcp2 tcp4 and tcp2 tcp3 tcp4 tcp10 center and margin regions for overrepresentation of the TCP binding motif GGACCA. C, Graphical display of MapMan analysis of gene expression for photosynthesis-related genes in tcp2 tcp3 tcp4 tcp10 margins compared with the wild type. D, Graphical display of relative expression changes of photosynthesis-related genes between center and marginal regions in the wild type (wt), tcp2 tcp4, and tcp2 tcp3 tcp4 tcp10 as determined by RNAseq experiments. The mutants tcp2 tcp4 and tcp2 tcp3 tcp4 tcp10 are labeled tcp2-4 and tcp2-3-4-10, respectively. E, Chlorophyll contents in developing young leaves as estimated by their fluorescence using a light scanning confocal microscope. Left, Wild type with closeup; right, tcp2 tcp3 tcp4 tcp10 with closeup. The colored bar indicates the fluorescence intensity profile used from blue (low fluorescence) to white (high fluorescence).

