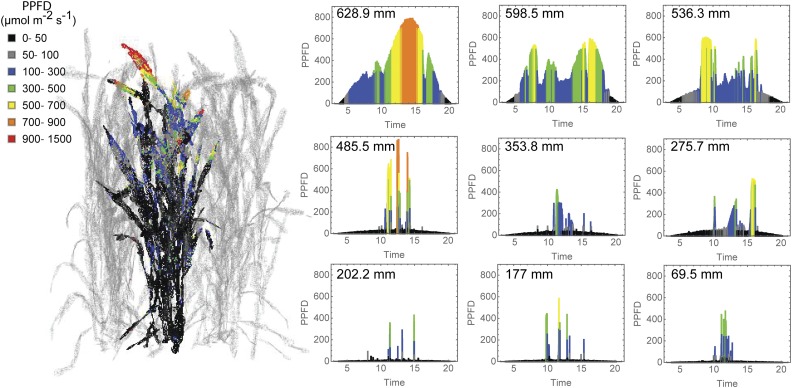
Figure 3.
Progressive lowering of the canopy position in a canopy results in the reduction in daily integrated PPFD (μmol m−2 s−1) but also in the pattern and incidence of high-light events within the canopy. The left side shows a representative reconstructed preanthesis wheat canopy with a single plant in bold. Maximum PPFD ranges are color coded. The right side shows PPFD during the course of a day at nine representative and progressively lower canopy positions (the height of each canopy location from the ground is given in the top left corner of each graph) calculated using ray-tracing techniques.

