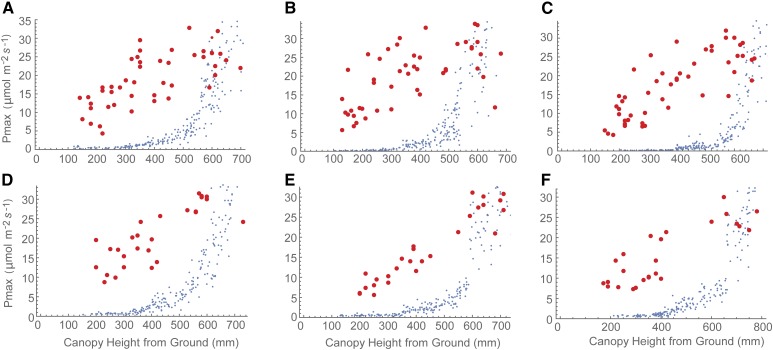
Figure 5.
Whole-canopy acclimation model output (blue) versus gas-exchange measurement (red) graphs. The acclimation model was run at 250 locations throughout the canopy depth to predict the optimal Pmax at each location dependent upon the light environment that it experienced, calculated via ray tracing. The time-weighted average (Eq. 4) was fixed at τ = 0.2. This is an exponentially decaying weight used to represent the fact that photosynthesis is not able to respond instantaneously to a change in irradiance levels. If τ = 0, a plant will be able to respond instantaneously to a change in irradiance, whereas if τ > 0, the time-weighted average light pattern will relax over the time scale τ. Model results are compared with field-measured gas exchange. A to C, Preanthesis. D to F, Postanthesis. A and D, Parent line. B and E, Line 1. C and F, Line 2.

