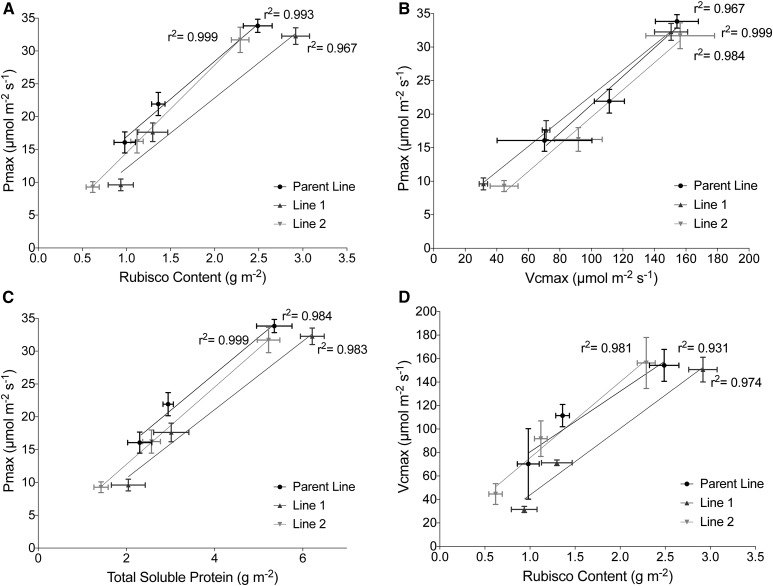
Figure 6.
Relationships between photosynthesis (Pmax taken from fitted LRCs) and Rubisco properties (Vcmax from fitted ACi curves and Rubisco/TSP amount) throughout the canopy depth. A, Pmax and Rubisco content. B, Pmax and Vcmax. C, Pmax and TSP. D, Vcmax and Rubisco content. Black (circles) represents the Parent line, dark gray (triangles) represents Line 1, and light gray (upside-down triangles) represents Line 2.

