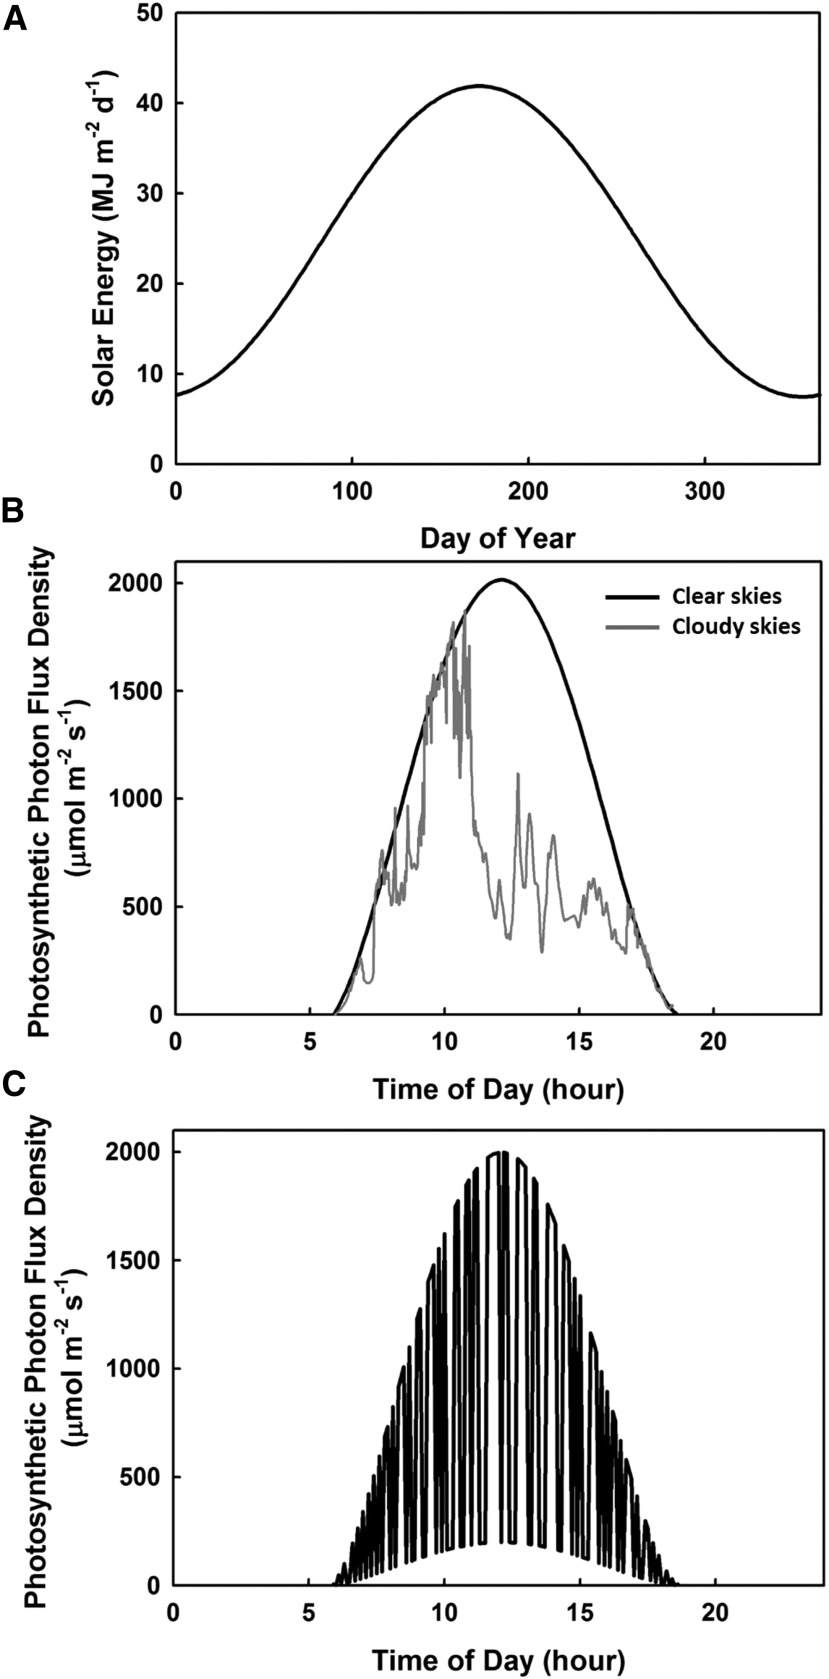
Figure 1.
Dynamics of light intensity above and within crop canopies. A, Maximum solar energy incident upon a canopy over the course of a year at 50°N. B, Light intensity at the top of a canopy on a clear sunny day (black line) and on a day with intermittent cloud cover (gray line). C, Light reaching a midcanopy leaf on a clear sunny day. Graphs are based on SURFRAD data from Bondville, Illinois (40°N latitude; B), and Zhu et al. (2004; C).

