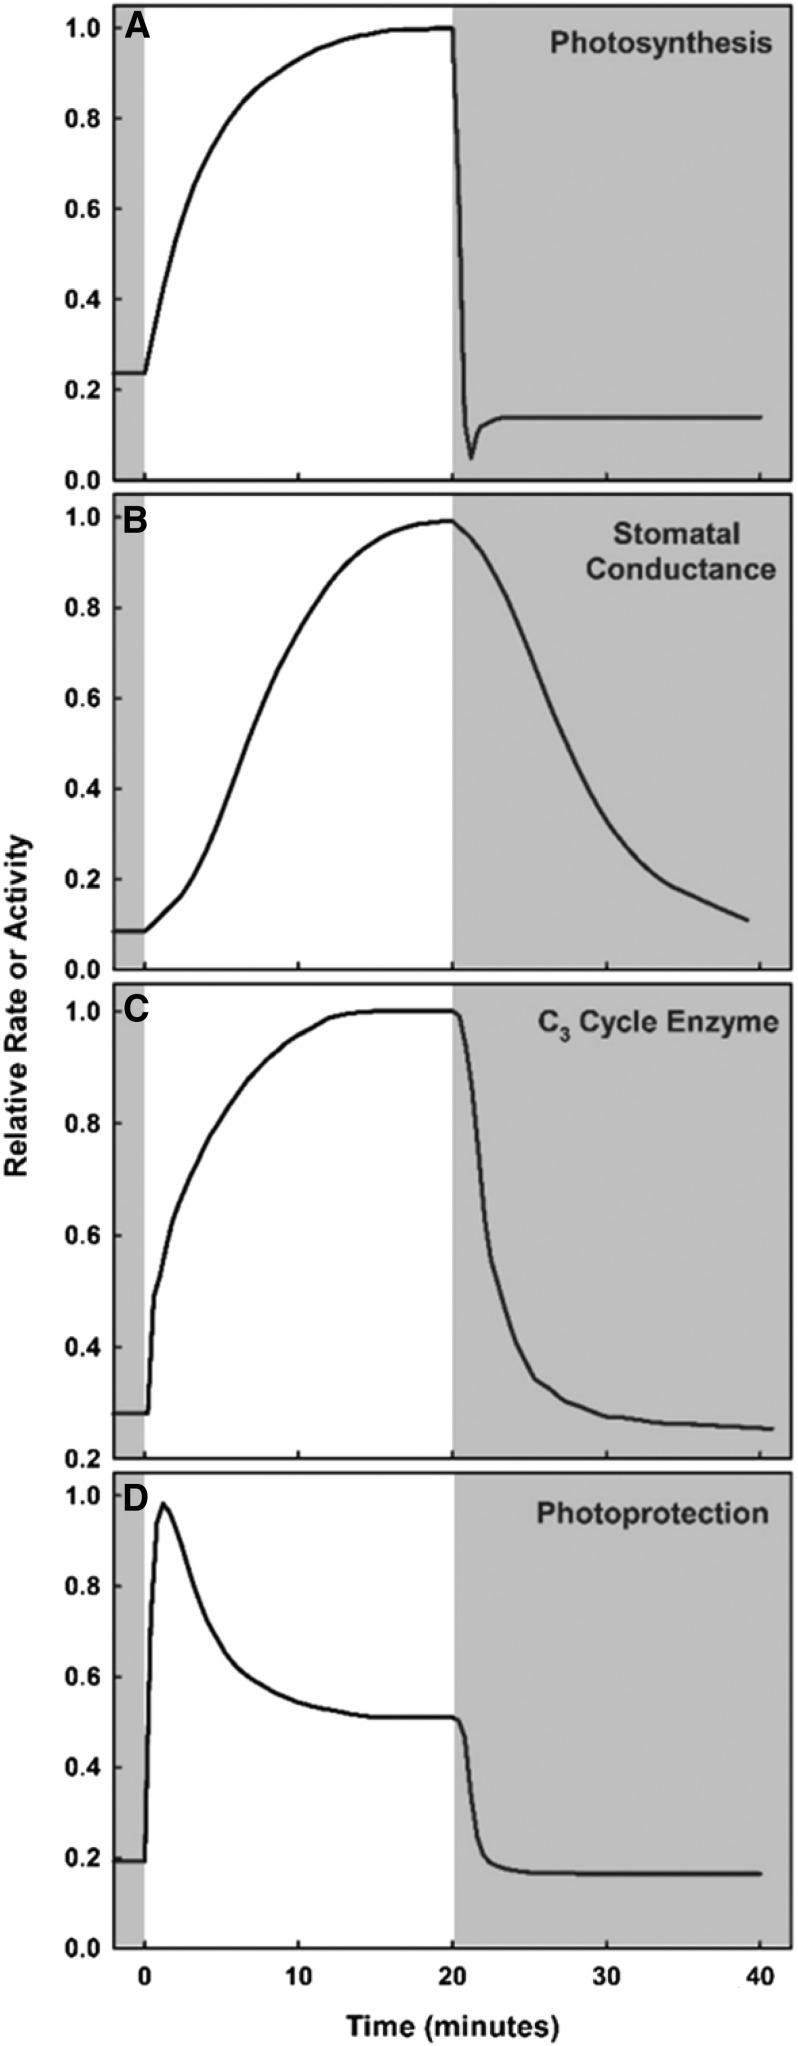
Figure 2.
Schematic showing the relative induction and relaxation rates of photosynthesis-related processes during changes in light intensity. Relative rates of photosynthesis (A), stomatal conductance (B), C3 cycle enzymes (C), and NPQ (D) are shown as functions of time during transitions from low light (gray background) to high light (white background) and from high light to low light. Curves are based on data from McAusland et al. (2016), Sassenrath-Cole and Pearcy (1994), and Kromdijk et al. (2016).

