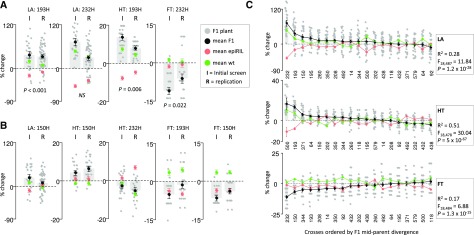
Figure 2.
Confirmation of midparent (MP) divergence in the initial screen and replicate experiment for epiHybrids 150H, 193H, and 232H. A, Results for cases of high-parent heterosis and low-parent heterosis for LA, HT, and FT in the initial and replicate experiments. B, Results for cases showing less prominent phenotypic effects for LA, HT, and FT. The MPV is shown as dashed horizontal lines, and the MP divergence is shown as change from MPV in percentage. To illustrate the F1 epiHybrid distribution for each trait, the individual replicate plants are depicted as dots. C, F1 MP divergence for LA, HT, and FT for all epiHybrids. The MPV is shown as horizontal dashed lines, and MP divergence is shown as change from MPV in percentage. The epiHybrids are ordered from highest (left) to lowest (right) F1 MP divergence. To illustrate the F1 epiHybrid distribution for each trait, the individual replicate plants are depicted as dots. Variance component analysis was used to estimate how much of the total variation in MP divergence can be explained by between-cross variation. The F-statistic from this analysis is shown in the boxes.

