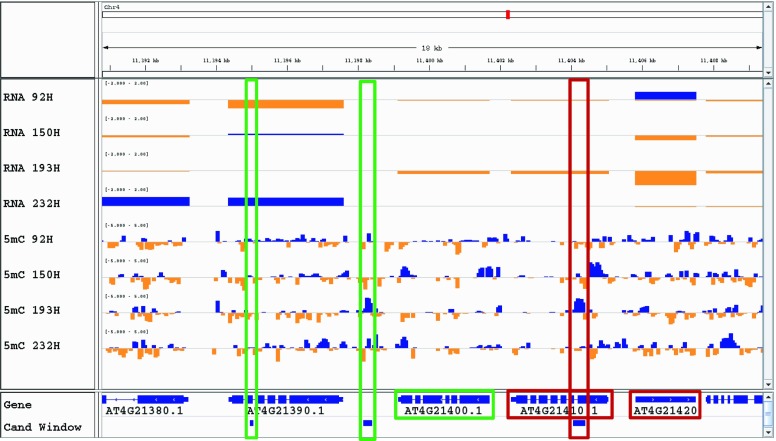
Figure 6.
Example of fold changes from MPV in gene expression and DNA methylation at candidate windows in epiHybrids where nonadditively expressed genes and nonadditively methylated regions are within 5 kb of each other. RNA tracks show gene expression-level fold changes, 5mC tracks show DNA methylation-level fold changes, the Gene track displays the gene annotation from TAIR10, and Cand Window presents the identified candidate windows. Blue and orange bars indicate positive and negative deviation from MPVs. Green and red boxes highlight the candidate windows and their associated genes.

