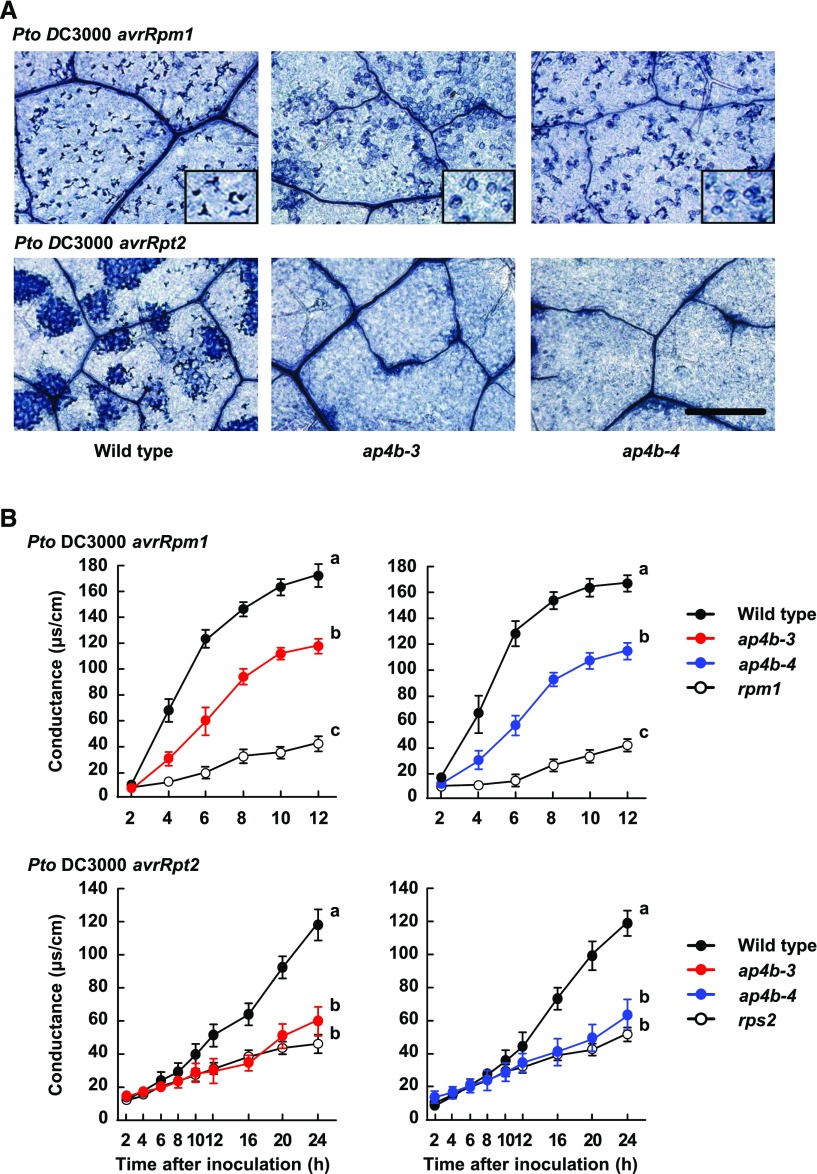
Figure 3.
Hypersensitive cell death induced by Pto DC3000 avrRpm1 and Pto DC3000 avrRpt2 is reduced in ap4b-3 and ap4b-4 plants. A, Trypan blue staining of dead cells in the leaves of wild-type, ap4b-3, and ap4b-4 plants at 12 h after inoculation with Pto DC3000 avrRpm1 (OD600 = 0.001) and at 24 h after inoculation with Pto DC3000 avrRpt2 (OD600 = 0.002). Bar = 500 µm. B, Electrolyte leakage from dying and dead cells in the leaves of wild-type, ap4b-3, ap4b-4, rpm1, and rps2 plants inoculated with Pto DC3000 avrRpm1 (OD600 = 0.1) and Pto DC3000 avrRpt2 (OD600 = 0.1). Error bars indicate ses of three independent experiments, each with four biological replicates. Different letters indicate significant differences at 12 h (Pto DC3000 avrRpm1) and 24 h (Pto DC3000 avrRpt2) (P < 0.05, two-tailed t tests).

