Figure 1.
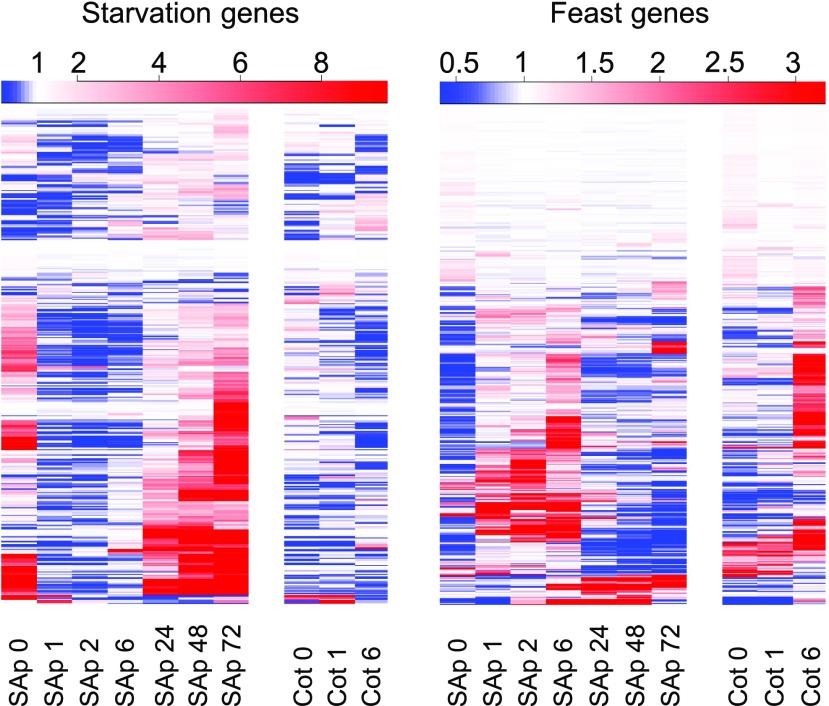
Shoot apices of 3-d-old seedlings exhibit in the dark a starvation response, which disappears within 1 h of light exposure. The expression levels of genes defined as carbon-repressed starvation and carbon-induced feast (Usadel et al., 2008) were plotted using data from a previous microarray experiment (López-Juez et al., 2008). Heat maps represent levels at each time point relative to the average level for the same gene across all time points (red, above; blue, below). SAp, Shoot apex; Cot, cotyledons. The number after each sample type indicates hours after light exposure. Color scales are shown above each plot.

