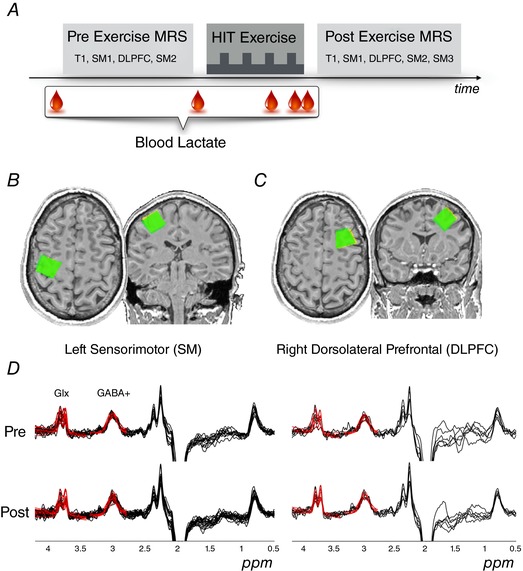
Figure 1. Overview of experiment.

MRS measures were obtained before and after HIIT exercise using MEGA‐PRESS tuned to detect GABA. A, following acquisition of an anatomical image (T1), MRS sequences were repeated for the left SM hand knob region and right DLPFC voxels. Lactate was measured from capillary blood at rest (× 2 baseline measures), during HIIT, as well as at the cessation of exercise. B and C, positioning of the SM and DLPFC voxels, respectively. The post‐exercise voxel (green) is overlaid upon the pre exercise voxel (yellow). D, difference spectra for all participants and timepoints are shown for each voxel (black lines). Model fit for each acquired difference spectrum is superimposed (red lines) for the GABA peak at 3.0 ppm and the Glx peak at 3.75 ppm. [Color figure can be viewed at wileyonlinelibrary.com]
