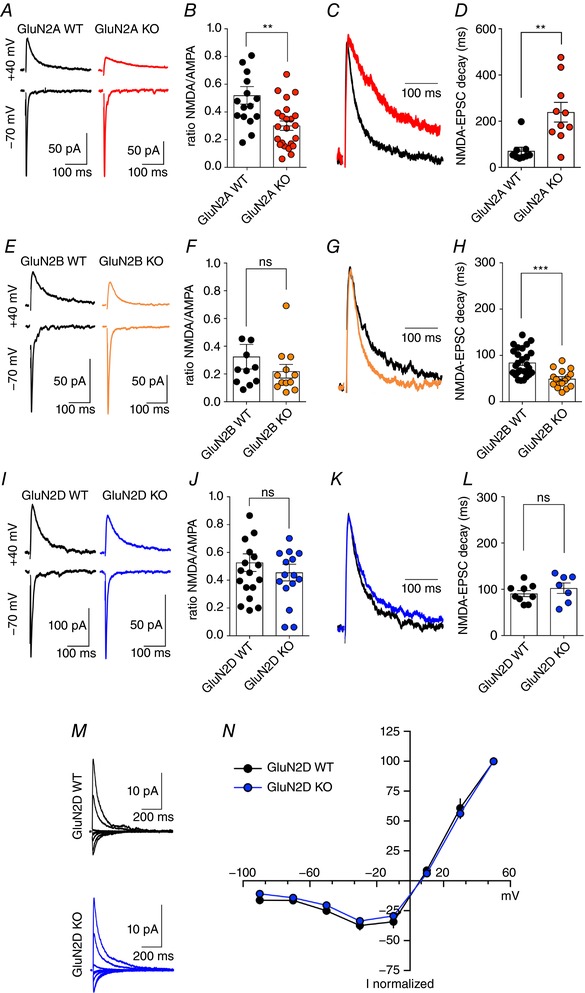
Figure 2. Selective GluN2‐subunit KO mice reveal the differential participation of GluN2A and GluN2B in MF‐NMDA EPSCs.

A and B, sample traces and summary plot illustrating the reduced NMDAR/AMPAR ratio in GluN2A KO mice at MF synapses, suggesting decreased levels of synaptic NMDARs (** P = 0.0023, Mann–Whitney test). C, peak scaled MF NMDAR‐EPSCs obtained from WT and GluN2A KO mice. D, summary graph illustrating the significant slowing down of MF NMDAR‐EPSCs when removing GluN2A subunits (** P = 0.0053, Mann–Whitney test). E and F, sample traces and summary plot showing similar NMDAR/AMPAR ratios in WT and GluN2B KO mice at MF synapses (P = 0.19, Mann–Whitney test). G, peak scaled MF NMDAR‐EPSCs obtained from WT and GluN2B KO mice. H, summary graph illustrating that despite similar NMDAR/AMPAR ratios, GluN2B subunits contribute significantly to NMDAR‐EPSC kinetics at MF synapses (*** P < 0.0001, Mann–Whitney test). I–L, genetic removal of GluN2D subunits does not significantly alter NMDAR/AMPAR ratio nor MF NMDAR‐EPSCs kinetics. Decay values represent the weighted decay calculated after using a double exponential fit of recorded NMDAR‐EPSCs (see Methods). M and N, sample traces and summary graph illustrating that the I–V curve recorded in GluN2D KO mice does not differ from that recorded in control littermate WT mice (GluN2D WT n = 6; GluN2D KO n = 8). [Color figure can be viewed at wileyonlinelibrary.com]
