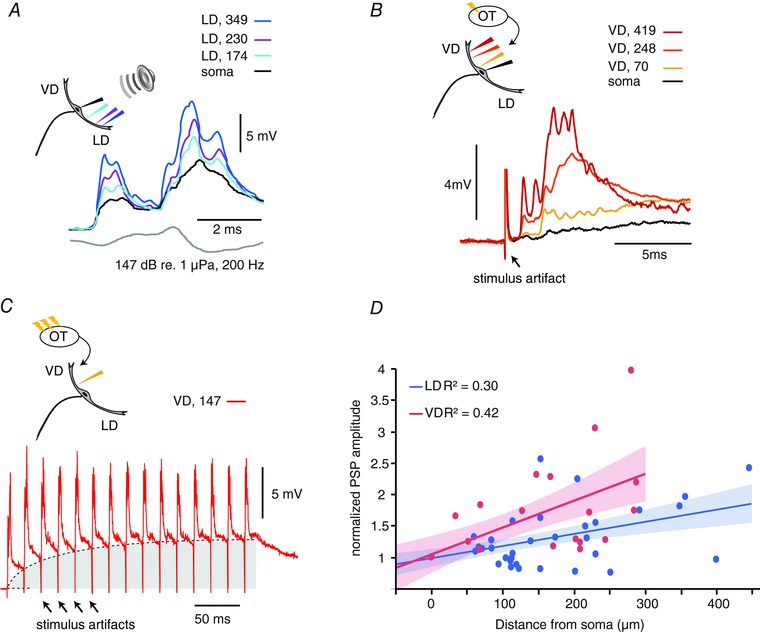
Figure 1. The VD shows a higher orthodromic spatial decay than the LD.

A, sample PSPs evoked by an auditory pip (grey lower trace) recorded at three LD locations and the soma. B, sample PSPs in response to single tectal stimulus. Note the short latency response (arrow). In (A) and (B), the colour code indicates the recording location with respect to the soma (μm). C, sample PSPs in response to a train (50 Hz, at 147 μm from soma) of tectal stimuli. Repetitive tectal stimulations evoke an underlying membrane depolarization (grey area) with superimposed EPSP (same neuron as in B). D, plot of the normalized PSPs amplitudes for the indicated recording locations along the VD (red dots) and LD (blue dots). Red (VD) and blue (LD) lines and shaded areas are linear fits and 95% confidence intervals, respectively. R 2, coefficient of determination. [Color figure can be viewed at wileyonlinelibrary.com]
