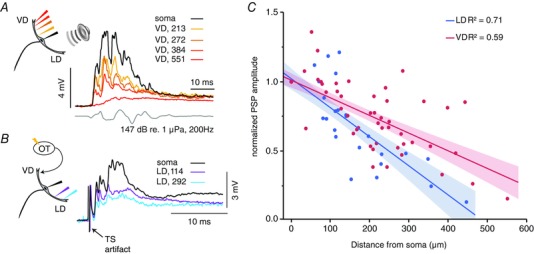
Figure 2. Auditory PSPs show higher cross‐modal backpropagation than VD PSPs.

A, sample PSPs evoked by an auditory pip (grey lower trace) recorded after propagating from the LD into the VD. Note: the still sizeable auditory PSP in the distal VD 550 μm away from soma. B, sample traces of PSPs evoked by TS as they propagate into the LD. In (A) and (B), the colour code indicates recording location with respect to the soma in μm. C, plot of the normalized amplitudes of auditory evoked PSPs in the VD (red dots) and tectal evoked PSP in the LD (blue dots) at the indicated recording locations. Red (VD) and blue (LD) lines and shaded areas are linear fits and 95% confidence intervals, respectively. R 2, coefficient of determination. [Color figure can be viewed at wileyonlinelibrary.com]
