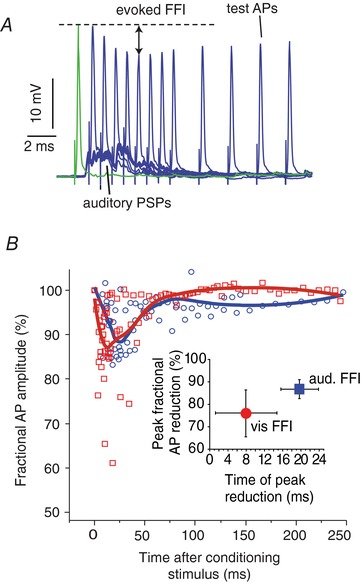
Figure 3. Tectal and auditory‐evoked FFI is similar in LD and VD.

A, sample superimposed traces from a single experiment of intrasomatic recorded PSPs in response to auditory pips paired with a subsequent antidromically test AP evoked at different time points (2–20 ms) after the pip. The fractional amplitude reduction of the test APs was compared with a control AP without a preceding auditory pip (green trace) to derive the evoked FFI. Similar methods were used to accessing TS evoked FFI. B, scatter plots showing the fractional AP reductions (%) from all experiments (n = 4) in response to pip (red squares) and TS (blue circles) stimuli over a range of lead times (0–250 ms). The measurements were fitted with a polynomial function to indicate the time course of visually (red) and auditory (blue) evoked FFI. Inset: mean ± SD (n = 4) AP peak reduction and peak time of FFI evoked by TS (red) and pip (blue) stimuli. [Color figure can be viewed at wileyonlinelibrary.com]
