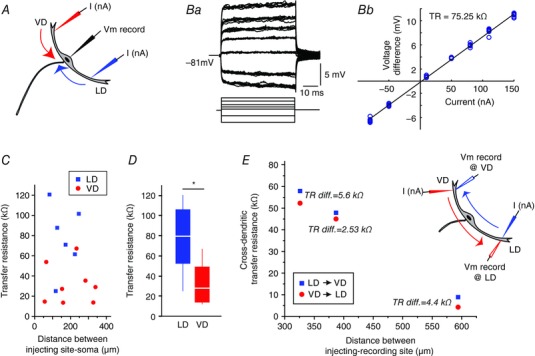
Figure 4. Differences in transfer resistance between LD and VD.

A, current ramps or square pulses were injected in different locations along the LD or VD (I nA) and the evoked voltage response was measured at the soma (Vm). B, sample traces showing membrane response to a family of current pulses (Ba) and the resulting I–V plot for determining TR (Bb) in the same experiment. C, plot of the individual TR measurements vs. soma‐dendritic distance for the LD (blue) or VD (red) and soma. Each symbol represents a different cell (n LD = 6, n VD = 8). D, box plots of TR obtained for the LD (blue, n = 6) and VD (red, n = 8) for all experiments. * P = 0.007. E, cross‐dendritic TR (n = 3) for LD → VD (blue squares) and VD → LD (red circles) for three experiments with the indicated difference in TR in the two reciprocal injection and recording directions. The current injected was the same in all sites tested. [Color figure can be viewed at wileyonlinelibrary.com]
