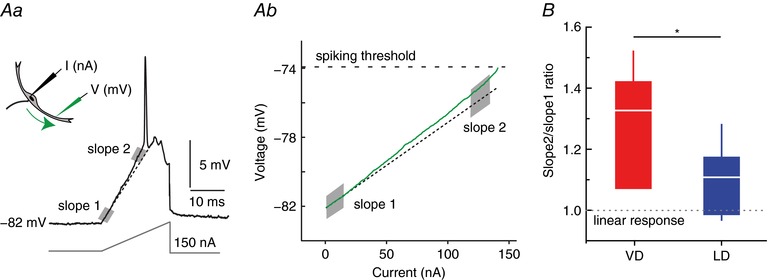
Figure 5. LD and VD show differences with respect to dendritic membrane non‐linearity.

A, to reveal voltage‐dependent membrane properties in the VD and LD, we injected current ramps (I nA) in the soma when recording membrane voltage (Vm) in the LD or VD with a second electrode (Aa). Ab, putative changes in resistance during membrane depolarizations where analysed in voltage current plots by comparing the I–V slopes close to RMP (slope 1 shaded region) and for depolarizations 2–3 mV below threshold (slope 2 shaded region). The sample traces show the response recorded in LD, 172 μm away from soma with a values of 34 and 43 kΩ for slope 1 and slope 2, respectively. Dashed line indicates a linear fit to slope 1. B, box plot of slope 2/slope 1 ratios for the VD (red, n = 4) and LD (blue, n = 8) indicate a higher value for the former (* P = 0.02). Dashed line indicates a hypothetical linear response of the membrane. [Color figure can be viewed at wileyonlinelibrary.com]
