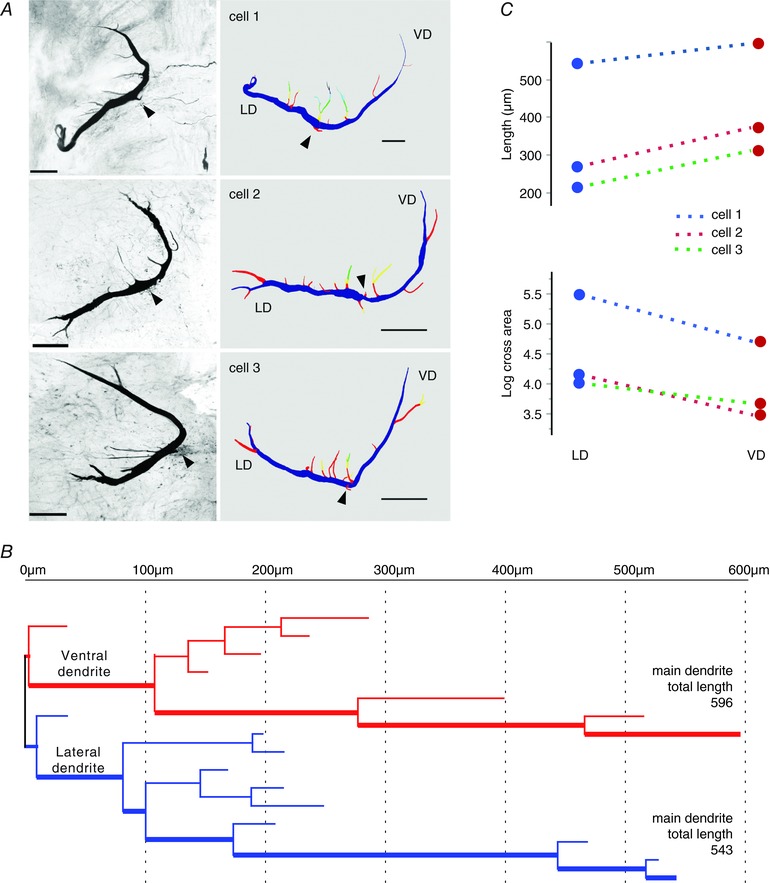
Figure 6. VD and LD show differences in dendritic morphology.

A, anatomical characterization of the M‐cell obtained by iontophoretic injection of rhodamine‐dextran dye followed by confocal imaging and 3‐D reconstruction using Neurolucida. Each row shows a different preparation (cells 1–3). Left: flattened anatomical stacks of stained M‐cells. Right: 3‐D reconstructions of the same cells coloured by branch order. Scale bars in all pictures = 100 μm. Arrowheads indicate the axon or its insertion point. B, dendritic branching pattern of cell 1 (top row in A). Red and blue lines define the branching pattern of VD and LD, respectively. The length of the main branch for each dendrite is indicated. The thick line denotes the main branch of the VD or LD. C, measurements of dendritic length (upper) and log cross area (lower) for the three cells showing consistent differences between LD and VD. [Color figure can be viewed at wileyonlinelibrary.com]
