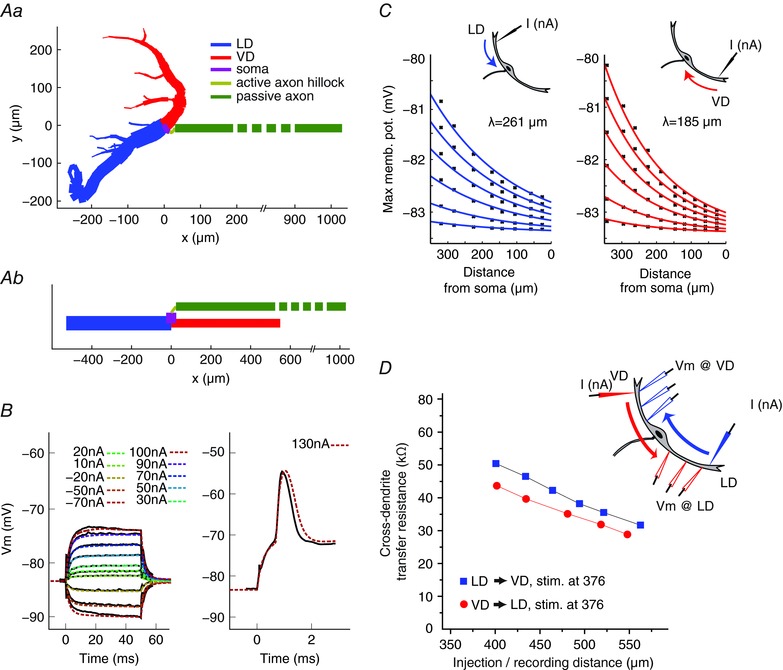
Figure 7. Dendritic morphology may account for observed orthodromic propagation differences.

Aa, neuronal M‐cell model based on realistic anatomy (cell 1 in Fig. 6). Axon morphology is based on data from the literature (see Methods). Ab, simplified neural model where the dendritic branches, axon hillock area and axon are represented by individual cylindrical compartments, which have the same length and total membrane area as the reconstructed cell 1 above. B, M‐cell somatic membrane responses to physiological (solid black line) and modelled (coloured dashed line) sub‐threshold (left) and supra‐threshold (right) current injections. C, plots of simulated membrane depolarization along the LD (left) and VD (right) in response to distal current injections of various strengths (see text). The theoretical dendritic space constants were determined by fitting the responses to the exponential form Â(x) = K exp(–cx) + E L on the logarithmic scale, where K is a constant that depends on the input current amplitude, c is the spatial decay, x is the distance from soma and E L is the leak reversal potential (resting state membrane potential). D, simulations of cross‐dendritic TR measured along the LD → VD (blue squares) and VD → LD (red circles) for an injecting electrode positioned 376 μm from soma. Note the steady decrease of TR with increasing inter‐electrode distance and that the LD → VD TR is always higher than the VD → LD TR. [Color figure can be viewed at wileyonlinelibrary.com]
