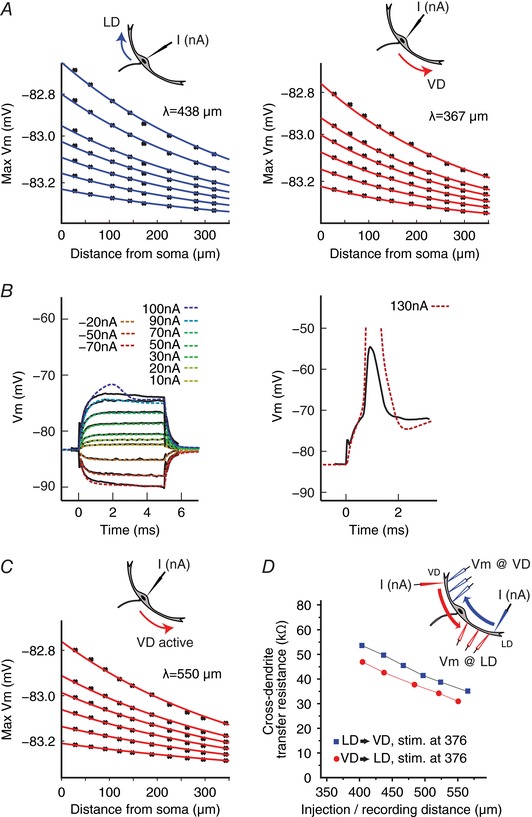
Figure 8. Active conductances might contribute to differences in antidromic signal propagation in the LD and VD.

A, plots of simulated membrane depolarizations along the LD (left) and VD (right) in response to somatic current injection considering realistic morphology but purely passive dendrites. The theoretical antidromic dendritic space constants (λ) were determined as in Fig. 7 C. B, behaviour of an M‐cell model incorporating active conductances. Somatic membrane responses to physiological (solid black line) and modelled (coloured dashed line) sub‐threshold (left) and supra‐threshold (right) current injections. C, plots of simulated membrane depolarizations along the VD, which includes active conductances l. D, simulations of cross‐dendritic TR in the active model (details as in Fig. 7 D). [Color figure can be viewed at wileyonlinelibrary.com]
