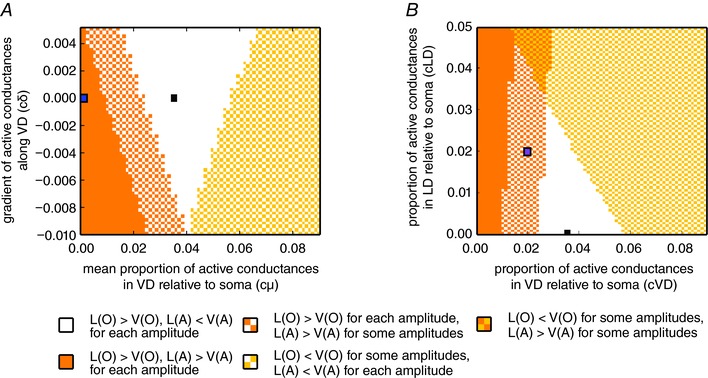
Figure 9. Model results are consistent for a wide range of densities and distribution of voltage‐dependent conductances in the VD and LD.

A, colour plot showing model predictions for the relationship between spatial decays in orthodromic (O) and antidromic (A) signal propagation as a function of the mean conductance density (c μ, x‐axis) and distribution (c δ, y‐axis) along VD. The black square represents the parameters used in the active model (Fig. 8), whereas the blue square represents the passive model (for the corresponding simulations, albeit with slightly different model parameters, Fig. 7; see also Methods). The white area shows the factors for which the spatial decay constants were qualitatively similar, as in experimental data for all amplitudes (i.e. the orthodromic spatial decay constant was larger in the LD and the antidromic spatial decay constant was larger in VD). The orange and yellow areas show the factors for which both spatial decay constants were larger in VD or LD, respectively. The checkerboard orange–white and yellow–white areas represent cases where either antidromic (orange–white) or orthodromic (yellow–white) propagation showed different qualitative results for different amplitudes, whereas the other type of propagation showed results that were consistent with the experiments for all amplitudes. B, robustness analysis on the quality of the model predictions when both dendrites possess active conductances. The colour plot is identical to that of (A), although only cases with c δ = 0 are considered here. The x‐axis shows the factors for the active conductances in the soma and four first compartments along the VD and the y‐axis shows the factors for those in the five first compartments along LD. For the default active model (black square) and models with sufficiently similar factors cVD and cLD (white area), the qualitative results for the spatial decays from the experiments were reproduced. The purple square represents a point were VD and LD have the same amount of active conductances and where the order of spatial decays depends on stimulus amplitude. [Color figure can be viewed at wileyonlinelibrary.com]
