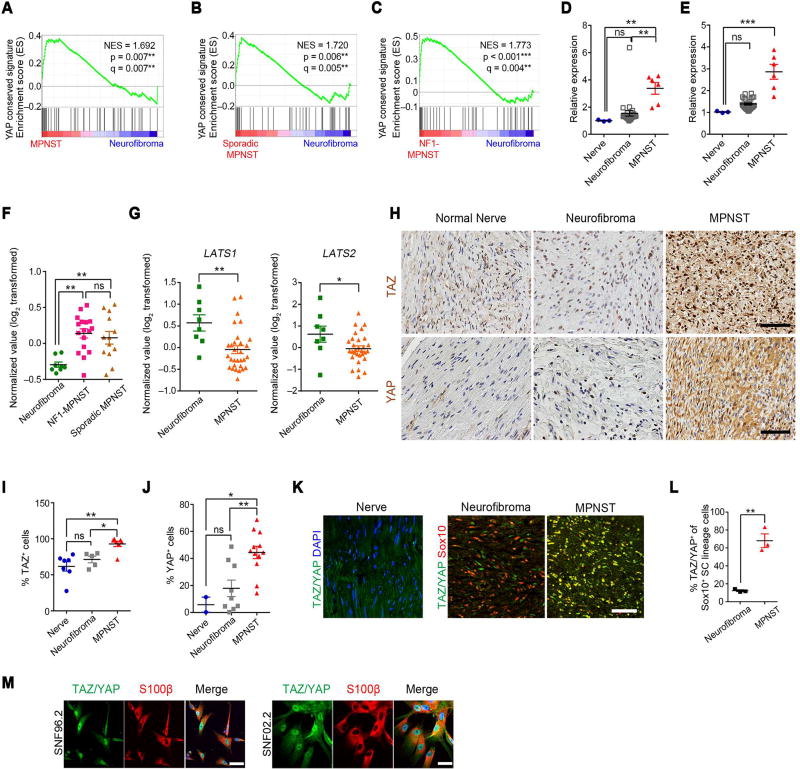
Figure 1. HIPPO-TAZ/YAP signature is elevated in human MPNSTs.
(A) GSEA plots show normalized expression signature (NES) of YAP conserved signature in human MPNSTs and neurofibromas from Jessen cohort.
(B–C) GSEA plots of YAP conserved signature in human sporadic MPNSTs (n = 13) (B) or NF1-MPNSTs (n = 17) (C) versus neurofibromas (n = 8) from the Kolberg cohort.
(D–E) Expression score of YAP conserved signature (D) and YAP activated signature (E) gene sets in MPNST (n = 6), neurofibroma (n = 26) relative to normal nerves (n = 3) from the Jessen cohort.
(F) Expression score of YAP activated signature gene set in NF1-MPNST (n = 17), sporadic MPNSTs (n = 13) and neurofibroma (n = 8).
(G) Average expression of LATS1 and LATS2 in MPNST (n = 30), neurofibroma (n = 8) from the Kolberg cohort.
(H) Immunohistochemistry (IHC) for TAZ and YAP in human MPNSTs, neurofibroma and normal sciatic nerves. Scale bars, 100 µm.
(I) Proportions of TAZ+ cells in human nerves (n = 7), neurofibroma (n = 5) and MPNSTs (n = 7).
(J) Proportions of YAP+ cells in human nerves (n = 2), neurofibroma (n = 9) and MPNSTs (n = 12). >500 cells counted per sample for J and K.
(K) Immunostaining for TAZ/YAP and DAPI in normal human nerve or Sox10 in human neurofibroma and MPNST sections. Scale bars, 50 µm.
(L) Proportions of TAZ/YAP+ cells among Sox10+ SC cells in human neurofibroma (n = 3) and MPNST (n = 3). >1,500 cells counted per sample.
(M) Immunostaining for TAZ/YAP and S100β in human SC-derived MPNST SNF02.2 and SNF96.2 cell lines. Blue in merged image shows DAPI labeling of nuclei. Scale bars, 50 µm. Each data point is presented with mean ± SEM indicated (*p < 0.05; **p < 0.01; ***p < 0.001; One-way ANOVA with Tukey’s multiple comparisons test in B, C, F, I, and J; Student’s t-test in G and L.). See also Figure S1.

