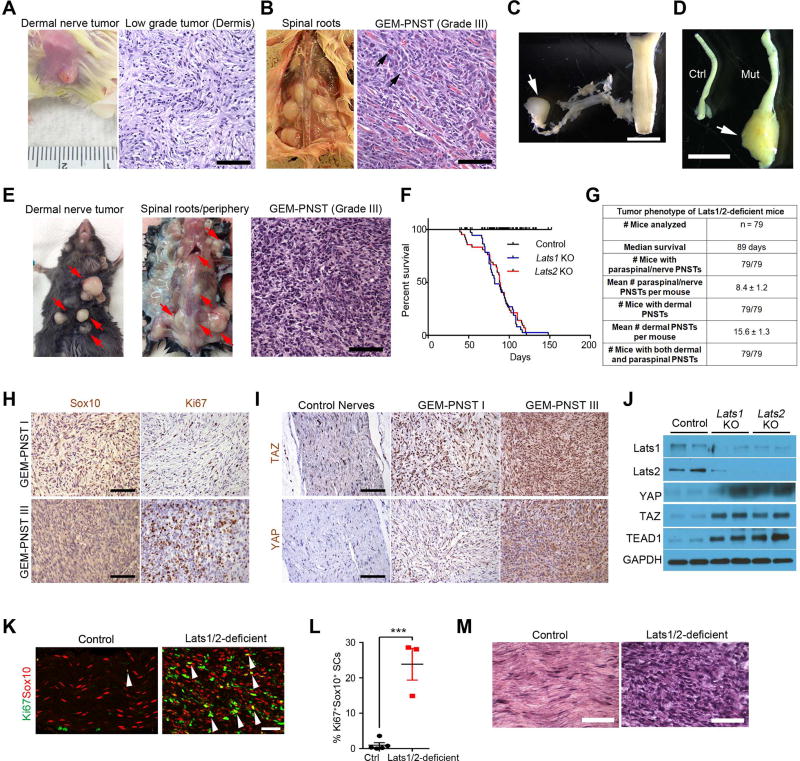
Figure 2. Mice with Lats1/2 deficiency in the SC lineage develop low and high grade GEM PNST tumors.
(A–B) Appearance and H&E staining of low-grade tumors on the dermis (A) and high-grade GEMPNST tumors from spinal nerve roots (B) from Lats1fl/flLats2fl/+;Dhh-Cre (Lats1 KO) mice at 3 months. Arrows: atypical nuclei.
(C) Spinal nerve root dissection harboring a tumor (arrow).
(D) An enlarged sciatic nerve (arrow) from Lats1 KO. Scale bars in A,B, 100 µm; C,D; 2 mm.
(E) Appearance and/or H&E staining of dermal tumors and paraspinal/nerve-associated GEM-PNST from Latsfl/+Lats2fl/fl:Dhh-Cre (Lats2 KO) at 2 months. Red arrows: tumor masses. Scale bar, 100 µm.
(F) Kaplan-Meier survival curves for control (n = 38), Lats1 KO (n = 37) and Lats2 KO (n = 42) mice. Control vs Lats1 or Lats2 KO mice, p < 0.0001, Log-rank tests.
(G) Quantification of tumor phenotypes in Lats1/2-deficient mice.
(H) IHC for Sox10 and Ki67 in low- and high-grade GEM-PNSTs in Lats1/2-deficient mice at 3 months. Scale bars, 100 µm.
(I) IHC for TAZ and YAP in control nerves, and low- and high-grade GEM-PNSTs in Lats1/2-deficient mice at 3 months. Scale bars, 100 µm.
(J) Immunoblotting of sciatic nerve lysates from control, Lats1 and Lats2 KO mice.
(K) Immunostaining for Ki67 and Sox10 in control and Lats1/2-deficient sciatic nerves at P21 (arrows: co-labelled cells). Scale bar, 50 µm.
(L) Quantification of Ki67+ SCs in P21 control (n = 5) and Lats1/2-deficient (n = 3) sciatic nerves. Each data point is presented with mean ± SEM (***p < 0.001; Student’s t-test).
(M) H&E staining shows control sciatic nerves and Lats1/2-deficient grade III GEM-PNST at 3 months old. Scale bar, 50 µm.
See also Figures S2 and S3.

