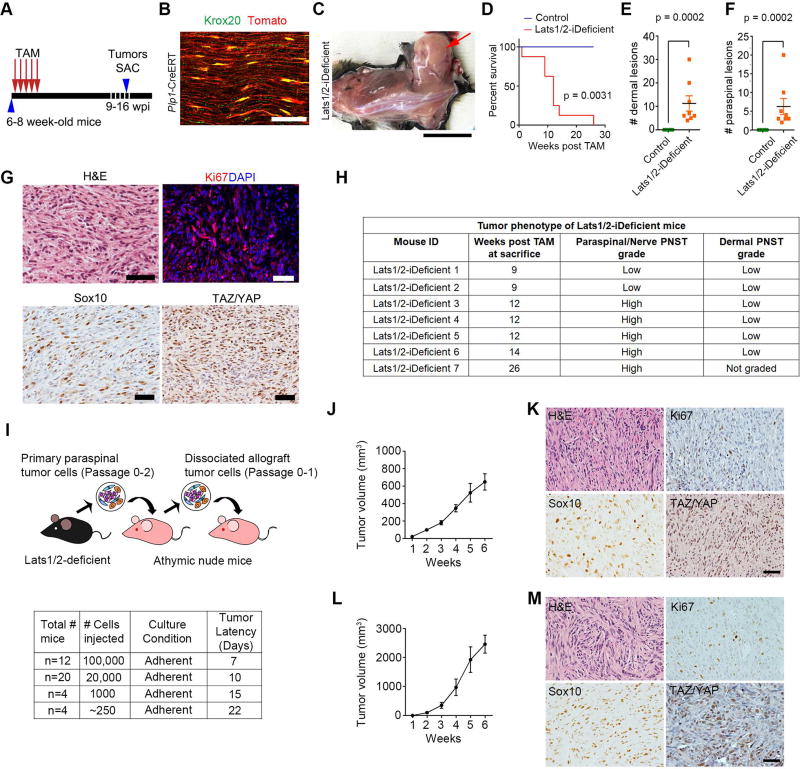
Figure 3. Lats1/2-deficient SCs are highly tumorigenic.
(A) A tamoxifen administration scheme to Lats1/2-iDeficient mice. Tumors were harvested (SAC) 9–16 weeks post injection (wpi).
(B) Tomato reporter expression in Krox20+ mature SCs in adult sciatic nerves of Plp1-CreERT at 5 weeks post tamoxifen induction. Scale bar, 50 µm.
(C) Formation of a GEM-PNST tumor (arrow) in Lats1/2-iDeficient after tamoxifen-induction at 10 wpi. Scale bar, 2 cm.
(D) Kaplan-Meier survival curves for control (n = 7) and Lats1/2-iDeficient (n = 8). Log-rank test was used to calculate p value.
(E–F) Dermal (E) or paraspinal/nerve (F) tumors in control (n = 7), Lats1/2-iDeficient (n = 8) mice. Each data point is presented with mean ± SEM (p = 0.0002; Mann-Whitney test).
(G) H&E and immunostaining for Ki67, Sox10, and TAZ/YAP in a paraspinal tumor from a Lats1/2-iDeficient mouse (9 wpi). Scale bars, 25 µm.
(H) Tumor phenotype in Lats1/2-iDeficient mice (n = 7). Low grade tumors are cellular and invading surrounding muscles/fat; high grade tumors are highly cellular, invasive and harbour mitotic figures.
(I) Diagram of allograft transplantation with Lats1/2-deficient cells. Bottom: tumor latency per number of transplanted Lats1/2-deficient cells for the primary recipients.
(J) Primary tumor growth in nude mice implanted with 1 × 10⁵ Lats1/2-deficient cells into the flanks. n = 9 mice.
(K) H&E-staining and IHC for Ki67, Sox10 or TAZ/YAP of primary Lats1/2-deficient allografts. Scale bar, 50 µm.
(L) Secondary tumor growth in nude mice implanted with 1 × 10⁶ Lats1/2-deficient tumor cells into the flanks. Data are as mean ± SEM in J and L; n = 10 mice.
(M) H&E-staining and IHC for Ki67, Sox10 or TAZ/YAP of secondary Lats1/2-deficient allografts. Scale bar, 50 µm.
See also Figure S4.

