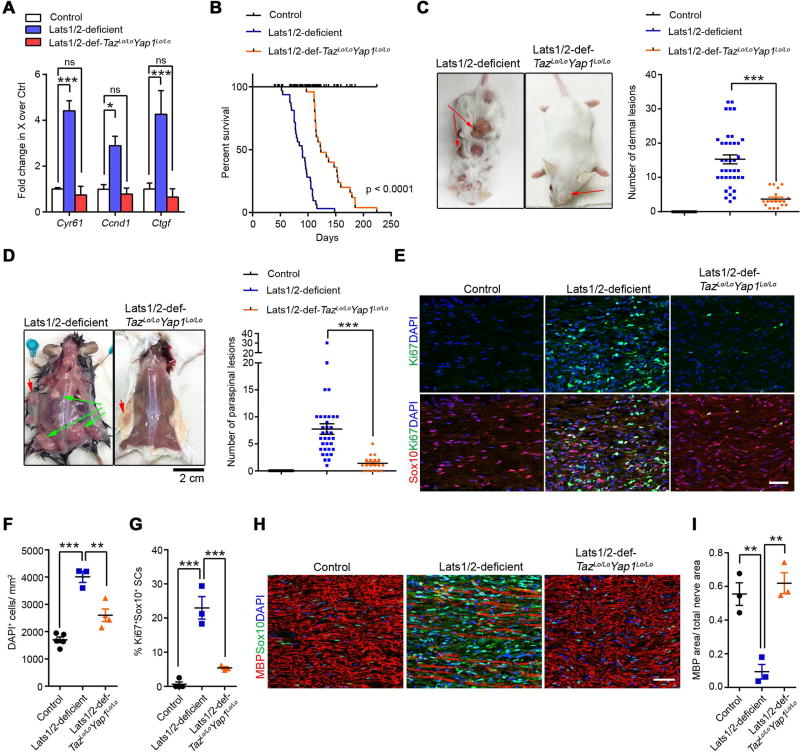
Figure 5. Genetic TAZ/YAP inactivation reduces tumor burden and extends life span in Lats1/2-deficient mice.
(A) qRT-PCR analysis of TAZ/YAP targets between control SNs, Lats1/2-deficient and Lats1/2-def-TazLo/LoYap1Lo/Lo paraspinal SNs. Data are as mean ± SEM (n = 3 independent experiments)
(B) Kaplan-Meier survival curves for control (n = 38), Lats1/2-deficient (n = 32) and Lats1/2-def-TazLo/LoYap1Lo/Lo mice (n = 25). p < 0.0001, between Lats1/2-deficient and Lats1/2-def-TazLo/LoYap1Lo/Lo; Log-rank test.
(C–D) Dermal tumor (C) and paraspinal/nerve tumor (D) number in control (n = 27), Lats1/2-deficient (n = 34) and Lats1/2-def-TazLo/LoYap1Lo/Lo (n = 18) mice. Green arrows: paraspinal tumors; Red arrows: dermal tumors.
(E) Immunostaining for Sox10 and Ki67 in 3-month-old control, Lats1/2-deficient and Lats1/2-def-TazLo/LoYap1Lo/Lo SNs. Scale bars, 50 µm.
(F–G) Total cell density (DAPI+ cells/mm2) (F) and Ki67+ Sox10+ SCs (G) in control, Lats1/2-deficient and Lats1/2-def-TazLo/LoYap1Lo/Lo SNs.
(H) Immunostaining for MBP and Sox10 in 3-month-old control, Lats1/2-deficient and Lats1/2-def-TazLo/LoYap1Lo/Lo SNs. Scale bars, 50 µm.
(I) The ratio of MBP+ area to total nerve area in control, Lats1/2-deficient and Lats1/2-def-TazLo/LoYap1Lo/Lo SNs.
Each data point is presented with mean ± SEM (n = 3–5 for each group; * p < 0.05, **p < 0.01, ***p < 0.001; One-way ANOVA with Tukey’s multiple comparisons test in A, F, G, I; Kruskal-Wallis test with Dunn’s multiple comparisons test in C, D).

