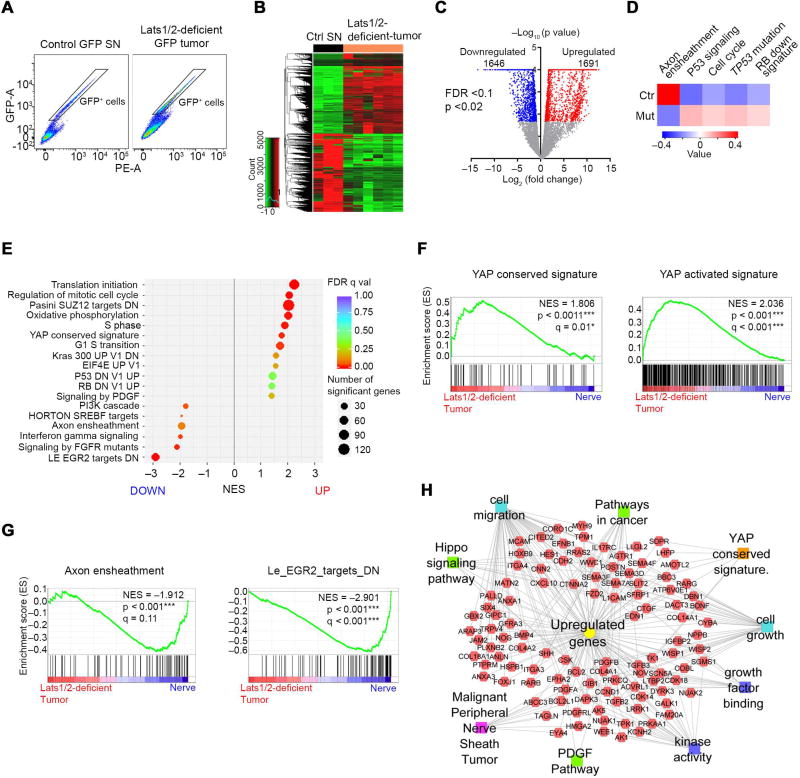
Figure 6. TAZ/YAP activation drives an oncogenic growth program in Lats1/2-deficient SCs.
(A) Isolation of GFP+ reporter-expressing SC cells by FACS from dissociated control SNs and Lats1/2-deficient paraspinal or nerve-associated tumors.
(B) Heatmap shows differentially expressed genes in Lats1/2-deficient GFP+ SCs (n = 6 mice) compared with control GFP+ SCs (n = 3 mice).
(C) Volcano plot of transcriptome profiles between control GFP+ SCs and Lats1/2-deficient GFP+ SCs. Red and blue dots represent genes significantly upregulated and downregulated in Lats1/2-deficient GFP+ SCs (p < 0.02, FDR < 0.1), respectively.
(D) Heatmap shows changes of pathway activity between control GFP+ SCs (n = 3) and Lats1/2-deficient GFP+ SCs (n = 6) based on MSigDB gene sets. Expression signature scores are the means with linkage hierarchical clustering.
(E) GSEA analysis of Lats1/2-deficient GFP+ SCs (n = 6) and control GFP+ SCs (n = 3) for top differentially regulated gene sets.
(F) GSEA plots of Lats1/2-deficient GFP+ SCs (Lats1/2-deficient tumor) show upregulation of YAP conserved signature (left) and YAP activated signature (right).
(G) GSEA plots of Lats1/2-deficient GFP+ SCs show downregulation of axon ensheathment (left) and Egr2 targets (right) gene sets.
(H) ToppCluster analysis of upregulated gene sets in Lats1/2-deficient GFP+ SCs.
See also Figure S6.

