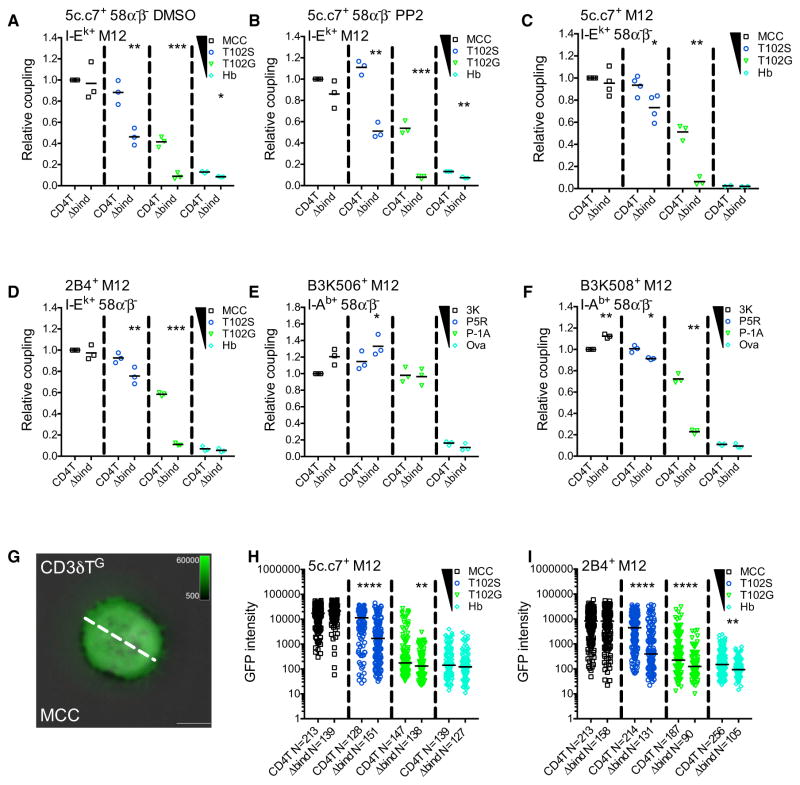
Figure 2. CD4 Enhances Cell Couple Formation and TCR Accumulation.
(A and B) Relative cell coupling between 5c.c7+ CD4T+ or CD4TΔbind+ 58α−β− cells cultured with the indicated tethered pMHCII+ M12 cells in the presence of (A) DMSO as a vehicle control or (B) PP2 to inhibit kinase activity.
(C–F) CD3T+ CD4T+ or CD4TΔbind+ M12 cells expressing the (C) 5c.c7 TCR, (D) 2B4 TCR, (E) B3K506 TCR, or (F) B3K508 TCR were cultured with 58α−β− cells expressing the indicated tethered pMHCII.
Cell coupling is shown relative to the couple frequency observed in the CD4T MCC condition for (A)–(D) or the CD4T 3K condition for (E) and (F). Each data point represents an individual experiment (3–4 experiments per condition); bars represent mean. Data were analyzed using a paired Student’s t test (*p < 0.05, **p < 0.01, ***p < 0.001). See also Figure S2.
(G) Representative TIRFM image showing CD3δTG accumulation on a MCC:I-Ek-coated surface (pseudocolored green) overlayed on a bright-field image. The dashed line represents the region of interest (ROI) exported for analysis. Scale bars represent 5 μm and look up tables indicate mEGFP intensity units.
(H and I) TCR-CD3 complex accumulation. Each dot represents GFP intensity of a single cell for (H) CD3δTG or (I) 2B4βG on immobile pMHCII surfaces with the indicated peptides. n = total number of analyzed cells per condition. Data were tested for normality using a D’Agostino and Pearson omnibus normality test followed by a Mann-Whitney test (*p < 0.05, **p < 0.01, ***p < 0.001, ****p < 0.0001). Results shown are representative of two experiments.

