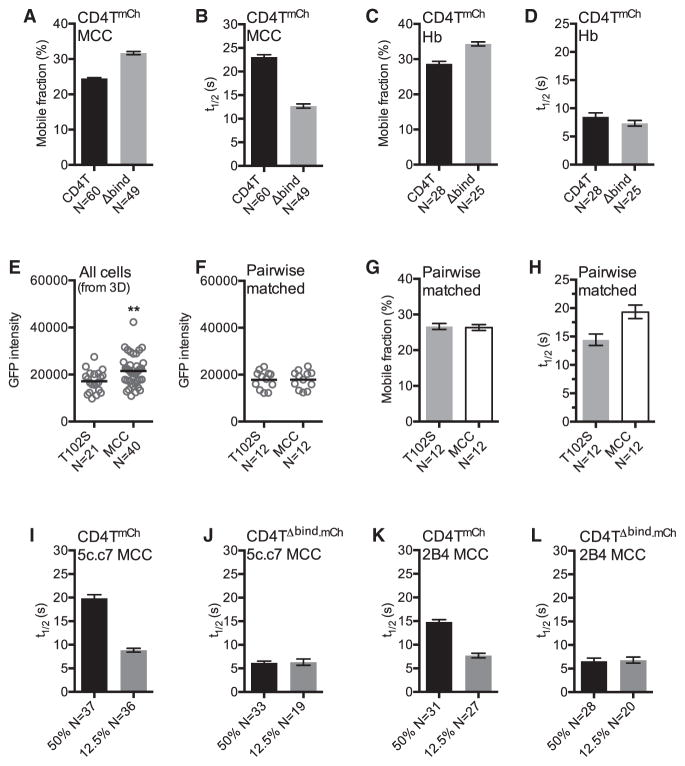
Figure 4. CD4 Dwell Time Depends upon TCR Engagement.
(A–D) 5c.c7+ CD4TmCh+ or CD4TΔbind. mCh+ M12 cells were adhered to (A and B) MCC:I-Ek or (C and D) Hb:I-Ek-coated surfaces for mCh FRAP analysis as in Figures 3E and 3F.
(E) mEGFP intensity of cells from Figure 3D on T102S or MCC surfaces. Values are post-mCherry bleaching to account for differences in intensity due to CD3δTG::CD4TmCh FRET (Glassman et al., 2016).
(F) mEGFP intensity of pairwise mEGFP intensity-matched cells (<5% variance) from (E).
(G and H) Mobile fraction (G) and mCh t1/2 (H) of pairwise mEGFP-matched cells from (F).
(I–L) mCh t1/2 for TCR+ CD4TmCh+ or CD4TΔbind. mCh+ M12 cells expressing the (I and J) 5c.c7 or (K and L) 2B4 TCR adhered to surfaces coated with 50% or 12.5% MCC:I-Ek diluted in Hb:I-Ek.
Data in (E) and (F) are presented as mean and analyzed by t test (**p < 0.01). n = number of cells analyzed per condition. Error bars for FRAP indicate 95% confidence interval. Results shown are representative of at least two experiments. See also Figure S4.

