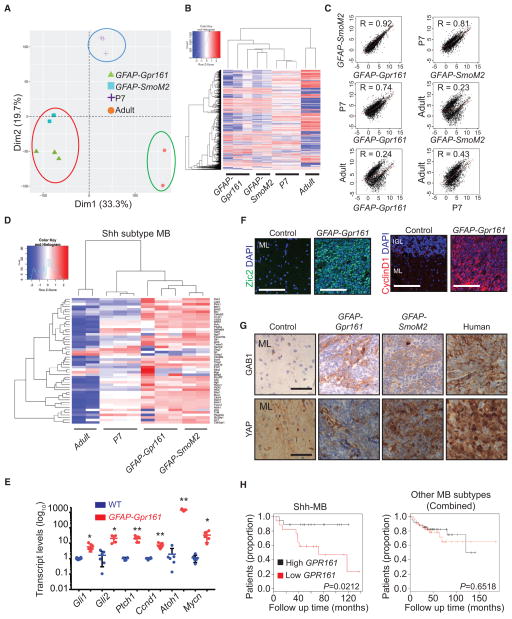
Figure 2. Gene Expression Profiles of Tumors Induced upon Gpr161 Deletion Resemble Shh Subtype Medulloblastomas.
(A and B) Principal-component analysis (PCA) (A) and hierarchical clustering analysis (B) of RNA-seq expression profiles of tumors from GFAP-Gpr161 cko mice (3–5 months old, n = 3), Shh-MBs from GFAP-SmoM2 mice (1 month old, n = 2), cerebellums of post-natal day 7 (P7, n = 3) mice, and adult mice (2 months old, n = 2). The x and y axes in the PCA plot are first- and second-principal components, and the percentages shown on each axis refer to the percent of variance being explained by the corresponding principal components (Dim1 and Dim2). GFAP-Gpr161 cko mice cluster with each other and are closely related to GFAP-SmoM2 mice. The heatmap shows genes with an average expression level higher than 1 transcript per kilobase million (TPM) and variance of expression of more than 2 across all 10 samples.
(C) Regression analysis of RNA-seq data shows that tumors of GFAP-Gpr161 cko mice and Shh subtype medulloblastoma of GFAP-SmoM2 mice have a higher Pearson correlation coefficient (R) than other comparisons. The x and y axes show the log2-transformed TPM values.
(D) Heatmap and clustering analysis of Shh subtype-specific transcripts show that tumors of GFAP-Gpr161 cko mice are similar to GFAP-SmoM2 tumors.
(E) qRT-PCR analysis of transcript levels of Shh-MB candidate genes in tumors of GFAP-Gpr161 cko mice (n = 6) compared with the WT cerebellums (n = 5).
(F) Tumors of GFAP-Gpr161 cko mice (3–10 months old) expressed the GC marker Pax6 and the Shh pathway target CyclinD1 upon immunostaining and co-staining with DAPI.
(G) Immunohistochemical analysis confirms that tumors from GFAP-Gpr161 cko mice exhibit an SHH subtype-specific staining pattern similar to mouse GFAP-SmoM2 tumors and human SHH-MB (human).
(H) Poor survival specifically in SHH-MB patients with low GPR161 expression in resected tumors (n = 52 in the SHH subtype and 135 in other subtypes combined). The top 50% and bottom 50% are considered high and low gene expression groups, respectively.
All data represent mean ± SD. Scale bars indicate (F) 100 μm and (G) 200 μm. *p < 0.05, **p < 0.01 by Student’s t test or as shown using log rank test (H). IGL, internal granule layer; WT, littermate control (Gpr161fl/fl or Gpr161fl/+). See also Figure S2.

